Unlock a world of possibilities! Login now and discover the exclusive benefits awaiting you.
- Qlik Community
- :
- All Forums
- :
- QlikView App Dev
- :
- Charts with unrelated dimensions
- Subscribe to RSS Feed
- Mark Topic as New
- Mark Topic as Read
- Float this Topic for Current User
- Bookmark
- Subscribe
- Mute
- Printer Friendly Page
- Mark as New
- Bookmark
- Subscribe
- Mute
- Subscribe to RSS Feed
- Permalink
- Report Inappropriate Content
Charts with unrelated dimensions
Hi guys,
in case I have 2 unrelated tables can I create a chart with dimensions from one table and data from another table?
Example:
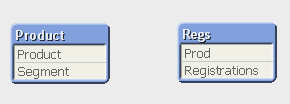
What I want to have is a chart with the Product field as a dimension and sum(Registrations) as an expression. Actually, it is Segment that I would like as a dimension, but that's already a secondary problem.
My idea was to create an expression like this:
sum({$<Prod=Product>} Registrations)
or
sum({$<Prod={$(=Only(Product))}>} Registrations)
or
sum({$<Prod={P(Product)}>} Registrations)
etc.
but none of these seem to be even close to the working version. However, apart from the dollar-sign expansion the expression Only(Product) works well in the chart.
Any ideas?
Best regards,
Valeriy Shylin
- Mark as New
- Bookmark
- Subscribe
- Mute
- Subscribe to RSS Feed
- Permalink
- Report Inappropriate Content
Hi Valeriy, what sort of problems are you getting with them? they look like they should work okay.
Regards,
Erica
- Mark as New
- Bookmark
- Subscribe
- Mute
- Subscribe to RSS Feed
- Permalink
- Report Inappropriate Content
Valeriy,
I assume that you don't want to just link these two tables by renaming one of the Product or Prod fields?
But Prod shares same values with Product?
Even if you get the Selection on field Prod right by assigning possible values of field Product (I would try something like
= sum({$<Prod= p(Product) >} Registrations)
for that), I think this is not what you want, since the sum probably won't take the current Product dimension value into account (the set expression is evaluated once outside the dimension context).
So I would suggest to use a record based comparison, maybe
=sum( if(Prod=Product, Registrations))
Hope this helps (and if not, maybe you could post a small sample of your data here, just a few inline table lines should be enough, together with your expected result),
Stefan
- Mark as New
- Bookmark
- Subscribe
- Mute
- Subscribe to RSS Feed
- Permalink
- Report Inappropriate Content
Hi guys,
thank for your replies.
Actually, the suggested expression sum({$<Prod= p(Product) >} Registrations) works fine, as you notice initially I had this idea but eventually I made a mistake in the expression thus invalidating it.
Registrations works perfectly well.
As for Industry I have the following problem.
I don't seem to be able to create a chart with Model in dimension. What I need is a sum of Industry per each Segment of each Model.
The sum({$<Prod= p(Product) >} Registrations) does not work any more since Model dimension does not impact the result of P function.
The expression sum(if(Segment_Ind=Segment,Industry)) produces a strange result which is twice as high as expected (I guess that depends on the number of total Models...).
Also, I don't seem to be able to make a Product dimension and ignore Product and Model selections, but instead consider Segment selections...
Find attached a test application.
- Mark as New
- Bookmark
- Subscribe
- Mute
- Subscribe to RSS Feed
- Permalink
- Report Inappropriate Content
Valeriy,
Yes, I think you get a sum per Model, so you need to correct it (if you need also a correct total, you need an advanced aggregation):
=sum(Aggr(sum(if(Segment_Ind=Segment ,Industry))/count(Model),Segment,Model))
And to use a Product dimension and ignore Product and Model while consider Segment, try:
=sum({$<Product_Reg=P({<Segment=Segment, Model=, Product=>}Product)>}Registrations)
See also attached,
Stefan