Unlock a world of possibilities! Login now and discover the exclusive benefits awaiting you.
- Qlik Community
- :
- All Forums
- :
- QlikView App Dev
- :
- Clickable Bar without dimension
- Subscribe to RSS Feed
- Mark Topic as New
- Mark Topic as Read
- Float this Topic for Current User
- Bookmark
- Subscribe
- Mute
- Printer Friendly Page
- Mark as New
- Bookmark
- Subscribe
- Mute
- Subscribe to RSS Feed
- Permalink
- Report Inappropriate Content
Clickable Bar without dimension
Hi Team,
Below is my table and chart. If I click the bar, it should show it individually. I took 3 expressions each has count(field) but no dimensions.
Table:
LOAD * Inline [
ID1,ID2,ID3,Date
1,18,31,12/12/2014
29,15,31,11/12/2015
10,13,1,10/12/2015
12,13,1,11/19/2015
];
Please suggest
Accepted Solutions
- Mark as New
- Bookmark
- Subscribe
- Mute
- Subscribe to RSS Feed
- Permalink
- Report Inappropriate Content
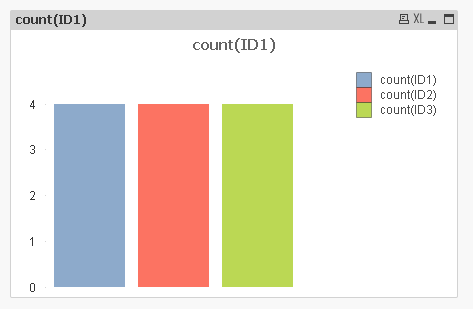
The only thing I can think of is to load a data island with a proxy dimension and use that as the chart dim.
LOAD * INLINE [
ProxyDim
1
2
3
]
;
Then use ProxyDim as the Dimension, and an expression of:
Pick(ProxyDim
,count(ID1)
,count(ID2)
,count(ID3)
)
You can color the background as:
=color(ProxyDim)
Not sure how to get a legend if you need one. See attached.
-Rob
- Mark as New
- Bookmark
- Subscribe
- Mute
- Subscribe to RSS Feed
- Permalink
- Report Inappropriate Content
Thanks so much Rob, that was wonderful