Unlock a world of possibilities! Login now and discover the exclusive benefits awaiting you.
- Qlik Community
- :
- All Forums
- :
- QlikView App Dev
- :
- Coloring the Max and Min Values in Pivot Table Row...
- Subscribe to RSS Feed
- Mark Topic as New
- Mark Topic as Read
- Float this Topic for Current User
- Bookmark
- Subscribe
- Mute
- Printer Friendly Page
- Mark as New
- Bookmark
- Subscribe
- Mute
- Subscribe to RSS Feed
- Permalink
- Report Inappropriate Content
Coloring the Max and Min Values in Pivot Table Rows with Multiple Dimensions
Hello,
I have a table as shown in the image below
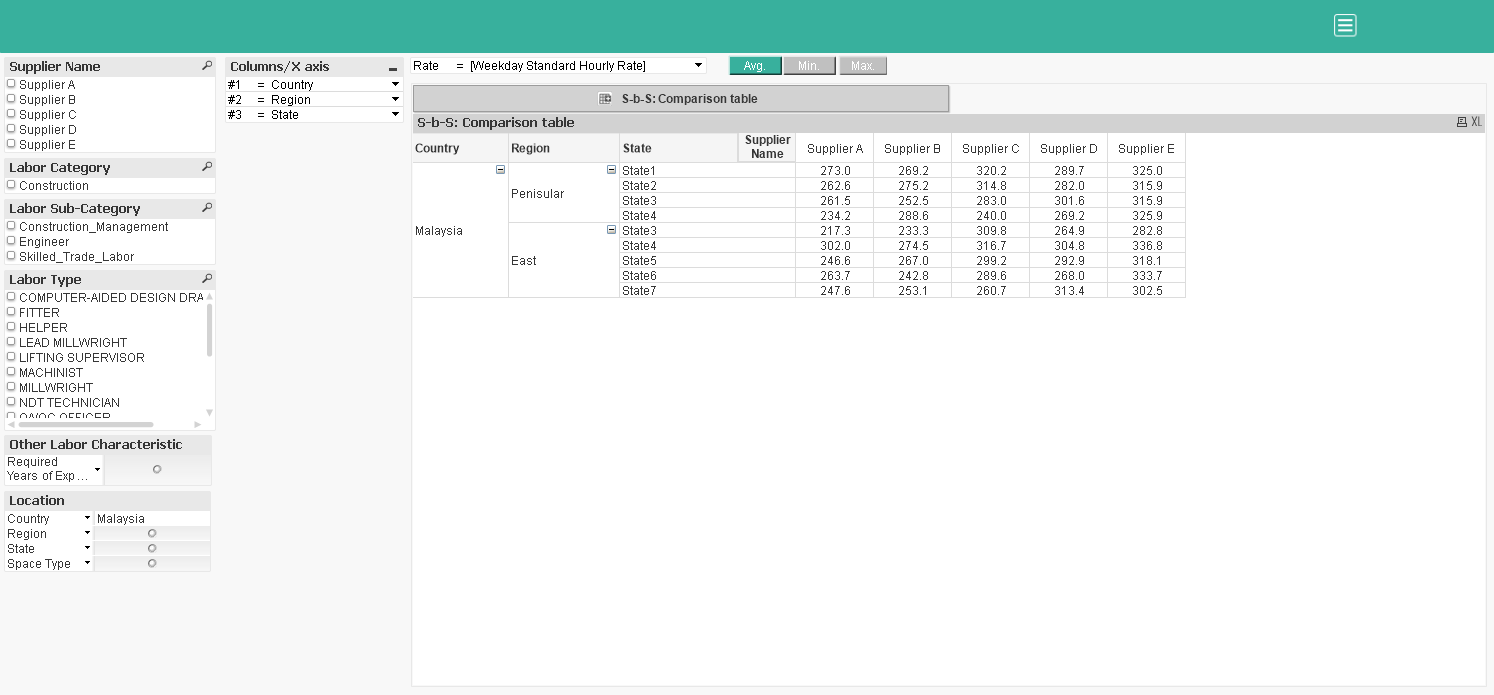
This table has the option of choosing multiple dimensions from a multi box named 'Columns/X-axis'. Now what I want is to color the minimum and maximum values in each row of the table. For example, say in the first row(Malaysia,Peninsular,State1) Supplier A has the least value(273) and Supplier E has max value(325). Say I'd like to color the least value(273) as green and max value(325) as red. I want to do this for all the rows in the table. Any help is much appreciated. I have tried the following expression in the Background option for the 'AVG' expression but it's not working:
if(Avg($(v_MP_Rate_Type))=Max(TOTAL <[Supplier Name]> $(v_MP_Rate_Type)),RGB(255,0,0))
I have attached the app for your reference. TIA! stalwar1
- « Previous Replies
- Next Replies »
Accepted Solutions
- Mark as New
- Bookmark
- Subscribe
- Mute
- Subscribe to RSS Feed
- Permalink
- Report Inappropriate Content
Hi,
Try with this in background color of the expression:
If(AVG = Min(TOTAL <$(v_MP_Dim_3)> Aggr(Avg($(v_MP_Rate_Type)), [Supplier Name], $(v_MP_Dim_1), $(v_MP_Dim_2), $(v_MP_Dim_3))), Red(),
If(AVG = Max(TOTAL <$(v_MP_Dim_3)> Aggr(Avg($(v_MP_Rate_Type)), [Supplier Name], $(v_MP_Dim_1), $(v_MP_Dim_2), $(v_MP_Dim_3))), blue()
))
Saludos
- Mark as New
- Bookmark
- Subscribe
- Mute
- Subscribe to RSS Feed
- Permalink
- Report Inappropriate Content
Hi fvelascog72,
I tried to do it with nested aggr, do you have an idea why it doesn't work like this ?
- Mark as New
- Bookmark
- Subscribe
- Mute
- Subscribe to RSS Feed
- Permalink
- Report Inappropriate Content
Hi,
You mean nested aggr instead nested if?
- Mark as New
- Bookmark
- Subscribe
- Mute
- Subscribe to RSS Feed
- Permalink
- Report Inappropriate Content
Yes 
- Mark as New
- Bookmark
- Subscribe
- Mute
- Subscribe to RSS Feed
- Permalink
- Report Inappropriate Content
That works! Thanks a lot Federico! Can you explain briefly the rationale behind this expressions if possible? Thanks again!
- Mark as New
- Bookmark
- Subscribe
- Mute
- Subscribe to RSS Feed
- Permalink
- Report Inappropriate Content
Could you write here what are you trying?
- Mark as New
- Bookmark
- Subscribe
- Mute
- Subscribe to RSS Feed
- Permalink
- Report Inappropriate Content
With the aggr you select all values and with the TOTAL <$(v_MP_Dim_3)> you choose row by row. More or less?
- Mark as New
- Bookmark
- Subscribe
- Mute
- Subscribe to RSS Feed
- Permalink
- Report Inappropriate Content
EDITED
First, i was trying this:
if(AVG = Min(Aggr(Avg($(v_MP_Rate_Type)), [Supplier Name], $(v_MP_Dim_1), $(v_MP_Dim_2), $(v_MP_Dim_3)))...
but on the table I have only one max value and one min value of all the lines.
and you added another aggregation on the dimension 3, with total <dimension 3>, I want to know why ?
and so I tried this, but it is not working:
if(AVG = aggr(Min(Aggr(Avg($(v_MP_Rate_Type)), [Supplier Name], $(v_MP_Dim_1), $(v_MP_Dim_2), $(v_MP_Dim_3))),$(v_MP_Dim_3)), Red())
- Mark as New
- Bookmark
- Subscribe
- Mute
- Subscribe to RSS Feed
- Permalink
- Report Inappropriate Content
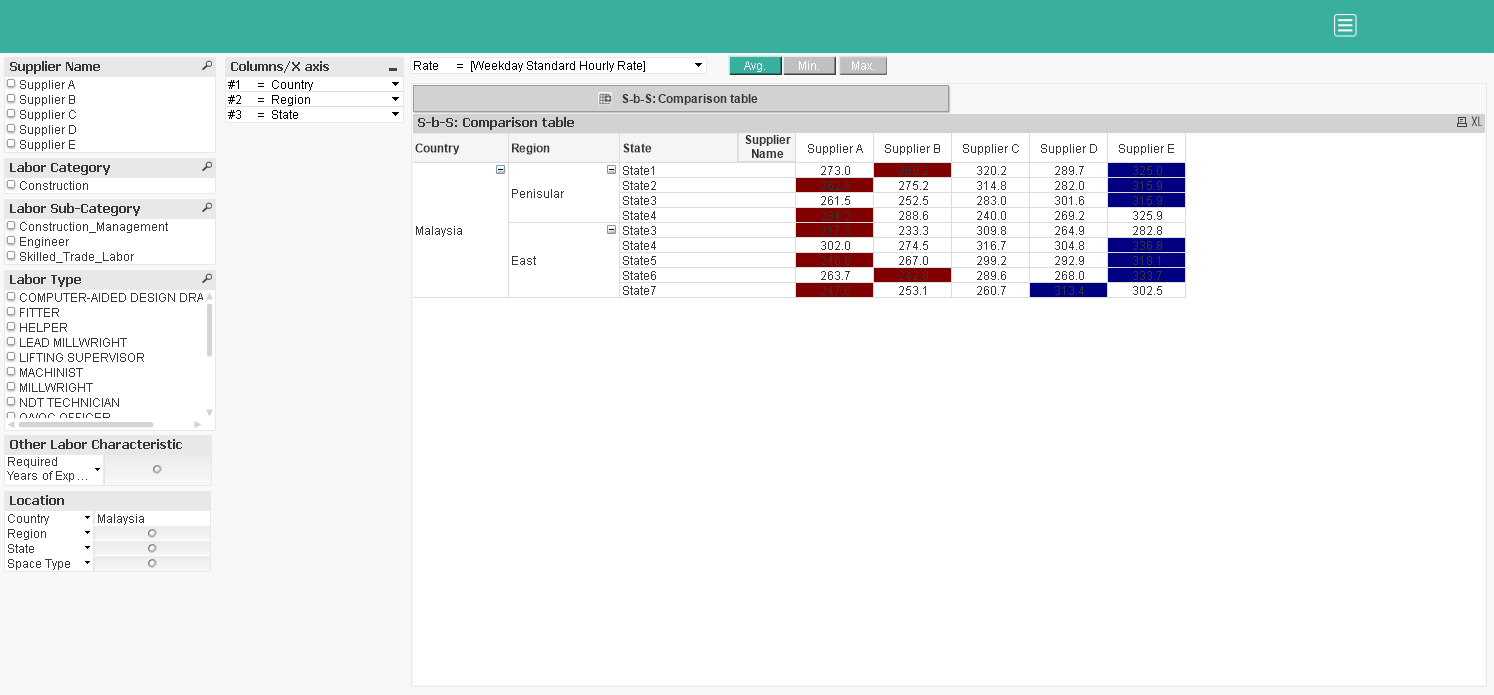
Hello Federico, I'm getting the result as shown in the image. As you can see, the coloring is happening for some rows but not for some other rows. For example you can see in Region 'East','State 3' only the Max value is colored while the Min value is not. Similarly, in Region 'Peninsular', only Min is colored and not max. This is happening because State 3 is present in both the regions I guess. Is there anyway we can modify this expression to get the two colors for each row. For example, in Region 'Peninsular', 'State 3' Supplier A should be colored in Red while Supplier E should be colored in blue? Thanks again!
- « Previous Replies
- Next Replies »