Unlock a world of possibilities! Login now and discover the exclusive benefits awaiting you.
- Qlik Community
- :
- All Forums
- :
- QlikView App Dev
- :
- Colors based on time
- Subscribe to RSS Feed
- Mark Topic as New
- Mark Topic as Read
- Float this Topic for Current User
- Bookmark
- Subscribe
- Mute
- Printer Friendly Page
- Mark as New
- Bookmark
- Subscribe
- Mute
- Subscribe to RSS Feed
- Permalink
- Report Inappropriate Content
Colors based on time
Hi All,
Can anyone tell me how to get color coding into charts much like they did in the salesforce demo app? They used a particular color for Past, Present, & Future.
http://us-b.demo.qlik.com/detail.aspx?appName=Salesforce.qvw
Accepted Solutions
- Mark as New
- Bookmark
- Subscribe
- Mute
- Subscribe to RSS Feed
- Permalink
- Report Inappropriate Content
you can dowload the .qvw to see (and copy too!) the different tricks
They used a a mix of different ways, not only one, so is a bit difficult to explain all.
example
for the bar chart at the center of the image
there are some variables (vCurrentQ) to identify the quarter
vPreviousQ ='Q' & if(Ceil(Month(vTodaysDate)/3)=1,4,Ceil(Month(vTodaysDate)/3)-1) & '-' & if(Ceil(Month(vTodaysDate)/3)=1,Right(Year(vTodaysDate),2)-1,Right(Year(vTodaysDate),2))
and in chart background color of the expression
if([Opportunity Close Quarter/Year]=vCurrentQ,rgb(245,165,3),if([Opportunity Close Quarter/Year]=vFutureQ,rgb(114,146,139),rgb(247,158,174)))
in other chart (the bar chart at the center left of the image) they used the color tab of the chart because they already know the color (Q4 --> pink)
- Mark as New
- Bookmark
- Subscribe
- Mute
- Subscribe to RSS Feed
- Permalink
- Report Inappropriate Content
Thanks.
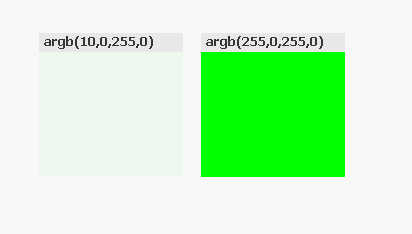
So - I'm unfamiliar with what the A in ARGB stands for, and how I can relate that to a particular color I'd like to use.
- Mark as New
- Bookmark
- Subscribe
- Mute
- Subscribe to RSS Feed
- Permalink
- Report Inappropriate Content
QlikView help
This function returns the color representation of a color defined by the red component e1, the green component e2 and the blue component e3 with an alpha factor (opacity) of alpha. All four parameters must be expressions evaluating to integers in the range between 0 and 255. The color representation is a dual value where the text representation comes in the form of 'RGB(a,r, g, b)' where a, r, g and b are numbers between 0 and 255 representing the alpha, red, green and blue color value respectively. The number representation is an integer representing the alpha, red, green and blue components as defined in Visual Basic.
and a quick test