Unlock a world of possibilities! Login now and discover the exclusive benefits awaiting you.
- Qlik Community
- :
- All Forums
- :
- QlikView App Dev
- :
- Column() function How and Where to use
- Subscribe to RSS Feed
- Mark Topic as New
- Mark Topic as Read
- Float this Topic for Current User
- Bookmark
- Subscribe
- Mute
- Printer Friendly Page
- Mark as New
- Bookmark
- Subscribe
- Mute
- Subscribe to RSS Feed
- Permalink
- Report Inappropriate Content
Column() function How and Where to use
Im trying to use the Column() function and it is not displaying or calculaing anything. I do not want to use the field name as this could change.
Im attaching a picture of the Straight table that I created. I want to do calculations on the difference bettween 2014-01 and 2014-03 (ulitmately I will have all year months calculated but for this test, Im ok with how the data looks) This data will be a rolling 18 months of data. In the Expressions I created a function which says Sum (Column(2) + Column(3)) It returns nothing. If I use this Sum([2014-01] + [2014-03]) I get the correct result. It wont even display andy data in Column(2) Any clue what I need to be doing differently. (Im very new to Qlikview)
- Tags:
- column()
- « Previous Replies
-
- 1
- 2
- Next Replies »
Accepted Solutions
- Mark as New
- Bookmark
- Subscribe
- Mute
- Subscribe to RSS Feed
- Permalink
- Report Inappropriate Content
According to the screenshots you posted, it's as Ioannis suggested. 2014-01 etc are Dimensions. The Column(n) function works only with chart Expression columns. When you use [2014-01] - [2014-03] you are referred to field names, not chart columns. You can make the fields Expressions instead of DImensions if you want to use Column().
-Rob
- Mark as New
- Bookmark
- Subscribe
- Mute
- Subscribe to RSS Feed
- Permalink
- Report Inappropriate Content
I presume you have year-month as dimension and only one expression.
so column will not work here as it refers to the expression so you have only Column one.
In order to do what you want, you need to use functions as peek, above etc.
- Mark as New
- Bookmark
- Subscribe
- Mute
- Subscribe to RSS Feed
- Permalink
- Report Inappropriate Content
I try
= Column(1)+Column(2)
- Mark as New
- Bookmark
- Subscribe
- Mute
- Subscribe to RSS Feed
- Permalink
- Report Inappropriate Content
Heres what it looks like
so no the year month is not a dimension. I ahve several columns. I did the pivot over in sqlserver and brought the data over as it looks flname 2014-01 2014-03 etc...(more year monnths) with a value of Production Per Hour in these columns))
- Mark as New
- Bookmark
- Subscribe
- Mute
- Subscribe to RSS Feed
- Permalink
- Report Inappropriate Content
i tried that but it didnt work (ive tried several options.... like that bummer its not working
- Mark as New
- Bookmark
- Subscribe
- Mute
- Subscribe to RSS Feed
- Permalink
- Report Inappropriate Content
this is what they have in excel and want in qv.... Ive never done a qv rpt so really have no clue where to start, Im assumming I need either a pivot table or a strait table. I can get the data where the P/C is by Year Month or I can pivot it in sql server and have the year months as columns when it comes to QV. How would you go about reproducing this rpt?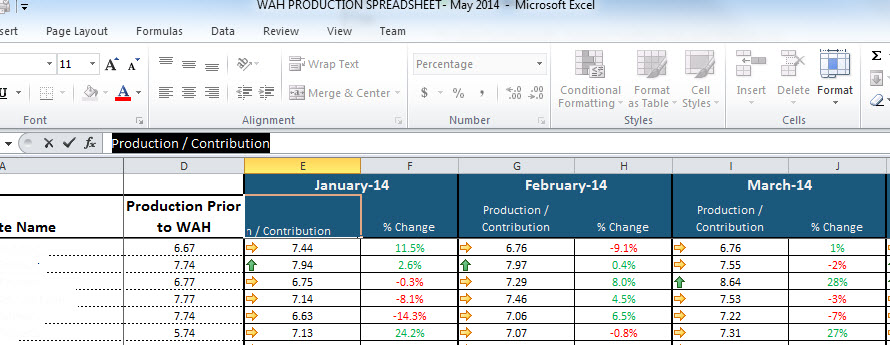
- Mark as New
- Bookmark
- Subscribe
- Mute
- Subscribe to RSS Feed
- Permalink
- Report Inappropriate Content
According to the screenshots you posted, it's as Ioannis suggested. 2014-01 etc are Dimensions. The Column(n) function works only with chart Expression columns. When you use [2014-01] - [2014-03] you are referred to field names, not chart columns. You can make the fields Expressions instead of DImensions if you want to use Column().
-Rob
- Mark as New
- Bookmark
- Subscribe
- Mute
- Subscribe to RSS Feed
- Permalink
- Report Inappropriate Content
Bring it in unpivoted.
1. Create a Pivot table chart.
2. Use DImensions Name, Month-Year.
3. Use expressions: =Production / Contribution.
4. Drag the Month-Year Column up to the right corner or the chart to make it horizontal.
Much easier to help if yo can post a small sample qvw.
-Rob
- Mark as New
- Bookmark
- Subscribe
- Mute
- Subscribe to RSS Feed
- Permalink
- Report Inappropriate Content
Yes that works!!!! Thanks so much Thanks for helping me understand.
- Mark as New
- Bookmark
- Subscribe
- Mute
- Subscribe to RSS Feed
- Permalink
- Report Inappropriate Content
Thanks as I will try this too! I never could get it to put the columns spread out(horizontal)
Beings new to this, I just don’t know the step by step process. Ill get there, thanks to your help!
- « Previous Replies
-
- 1
- 2
- Next Replies »