Unlock a world of possibilities! Login now and discover the exclusive benefits awaiting you.
- Qlik Community
- :
- All Forums
- :
- QlikView App Dev
- :
- Column with a relative percentage to the total
- Subscribe to RSS Feed
- Mark Topic as New
- Mark Topic as Read
- Float this Topic for Current User
- Bookmark
- Subscribe
- Mute
- Printer Friendly Page
- Mark as New
- Bookmark
- Subscribe
- Mute
- Subscribe to RSS Feed
- Permalink
- Report Inappropriate Content
Column with a relative percentage to the total
Hello,
I have a pivot table with a column defined as an expression..
Y Column
Y1 value of expresion (4)
Y2 value of expresion (6)
Y3 value of expresion (10)
Total total (20)
I need to change this column to show the relative percentage of the value to the total.
Y Column
Y1 20%
Y2 30%
Y3 50%
Total 100%
I tried to use the total (expression) functions but I am struggling with it.
Any ideas?
Thanks in advance,
Regards
- Tags:
- relative to total
- Mark as New
- Bookmark
- Subscribe
- Mute
- Subscribe to RSS Feed
- Permalink
- Report Inappropriate Content
Can you share your data or qwv?
- Mark as New
- Bookmark
- Subscribe
- Mute
- Subscribe to RSS Feed
- Permalink
- Report Inappropriate Content
Sorry,
I can not share the data or qvw for privacy reasons.
The expression is:
(
Sum({<[Soort medewerker]={'Personeel'},Verzuimduurklasse=>} #FTE )/
count(DISTINCT {<[Soort medewerker]={'Personeel'},Verzuimduurklasse=>} Maand)
)
*
(
sum({<_verleden={"1"},[Soort medewerker]={'Personeel'},Verzuimduurklasse=>} #Dag_ziek_gewogen_excl) /
sum({<_verleden={"1"},[Soort medewerker]={'Personeel'},Verzuimduurklasse=>} #Dag_gewerkt_gewogen_VP )
)
This resulting value must be set as relative percetgae to the total of the rows .
Thanks for offering help.
Regards,
Wim Steskens
- Mark as New
- Bookmark
- Subscribe
- Mute
- Subscribe to RSS Feed
- Permalink
- Report Inappropriate Content
Hello,
I have a data file and a qvw file with a exeample to make it clear.
You will find some dimensions and data columns in the data file.
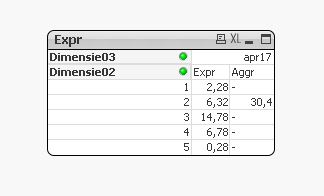
In the added screenshots of the app is the month apr17 selected.
The problem is that the value of the aggegation expressions is shown only on one row of the table.(see screenshot)
Clicking on another row makes the aggrgation appear at this row.(see screenshot ).

Any suggestions ? Thanks for your help in advance.
Regards
Wim Steskens
- Mark as New
- Bookmark
- Subscribe
- Mute
- Subscribe to RSS Feed
- Permalink
- Report Inappropriate Content
Hello,
I have added a data file and a qvw file with a exeample to make it clear.
You will find some dimensions and data columns in the data file.
In the added screenshots of the app is the month apr17 selected.
The problem is that the value of the aggegation expressions is shown only on one row of the table.(see screenshot)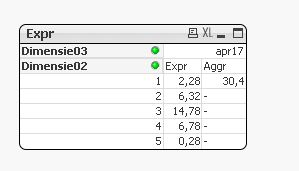
Clicking on another row makes the aggrgation appear at this row.(see screenshot ).
Any suggestions ? Thanks for your help in advance.
Regards
Wim Steskens