Unlock a world of possibilities! Login now and discover the exclusive benefits awaiting you.
- Qlik Community
- :
- All Forums
- :
- QlikView App Dev
- :
- Combine set expression with list box
- Subscribe to RSS Feed
- Mark Topic as New
- Mark Topic as Read
- Float this Topic for Current User
- Bookmark
- Subscribe
- Mute
- Printer Friendly Page
- Mark as New
- Bookmark
- Subscribe
- Mute
- Subscribe to RSS Feed
- Permalink
- Report Inappropriate Content
Combine set expression with list box
Hi all,
Can anyone help with the following?
I have a chart in which set analysis is used. Simplified the expression is:
=Count(DISTINCT {$<Year={2018,2017,2016}>}Year)
In the app is also a list box containing Year.
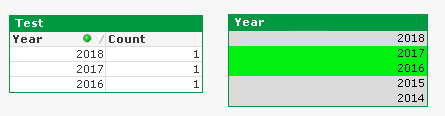
What I want: A chart in which only the three mentioned values are shown. When the list box is used, I want to further filter the chart. Example:
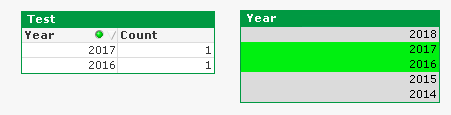
However, what I get: The chart doesn't respond to the list box. I thought using the dollar-sign would make it possible to further filter, but it's not. Example:
Can you provide me with a solution for this? Thanks in advance!
Greetings, Janneke.
Accepted Solutions
- Mark as New
- Bookmark
- Subscribe
- Mute
- Subscribe to RSS Feed
- Permalink
- Report Inappropriate Content
Try it with this one: =Count(DISTINCT {$<Year *= {2018,2017,2016}>}Year)
- Marcus
- Mark as New
- Bookmark
- Subscribe
- Mute
- Subscribe to RSS Feed
- Permalink
- Report Inappropriate Content
Try it with this one: =Count(DISTINCT {$<Year *= {2018,2017,2016}>}Year)
- Marcus
- Mark as New
- Bookmark
- Subscribe
- Mute
- Subscribe to RSS Feed
- Permalink
- Report Inappropriate Content
Hi Marcus,
Thanks a lot, this does the trick!
Janneke.