Unlock a world of possibilities! Login now and discover the exclusive benefits awaiting you.
- Qlik Community
- :
- All Forums
- :
- QlikView App Dev
- :
- Combining sums of two tables, how to?
- Subscribe to RSS Feed
- Mark Topic as New
- Mark Topic as Read
- Float this Topic for Current User
- Bookmark
- Subscribe
- Mute
- Printer Friendly Page
- Mark as New
- Bookmark
- Subscribe
- Mute
- Subscribe to RSS Feed
- Permalink
- Report Inappropriate Content
Combining sums of two tables, how to?
Hi,
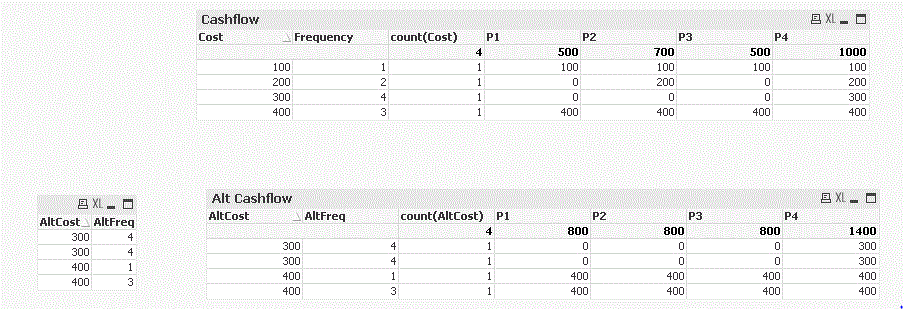
I have two straight tables within qlikview and want to combine the totals of specific columns into one table. How do I go about this?

This logic allows for comparing two cashflows.
in a new table hence i would like to see:
Table | P1 | P2 | P3 | P4
Cashflow | 500 | 700 | 500 | 1000
Alt Cashflow | 800 | 800 | 800 | 1400
Cheers Ronny.
- Mark as New
- Bookmark
- Subscribe
- Mute
- Subscribe to RSS Feed
- Permalink
- Report Inappropriate Content
This depends on the nature of your expressions. If they are fairly simple, then it's enough to repeat the same expressions without the original dimensions. In order to differentiate between the two "tables", you may add a Synthetic Dimension with 2 values - "Cash Flow" and "Alt Cash Flow" (using the function ValueList() ).
If your expressions are more complex and can only be calculated at a specific level of detail, you may have to use advanced aggregation AGGR and enforce the calculation at the original level of detail, before aggregating it further into the total level.
best,
Oleg Troyansky
- Mark as New
- Bookmark
- Subscribe
- Mute
- Subscribe to RSS Feed
- Permalink
- Report Inappropriate Content
Something for you to do at script level, yes you could use expressions to do that, again depends on the datamodel. You need to give more information.
thanks,
Rajesh Vaswani
- Mark as New
- Bookmark
- Subscribe
- Mute
- Subscribe to RSS Feed
- Permalink
- Report Inappropriate Content
I am wondering how to design this.
The table that I am looking at has two columns, cash and frequency.
To generate a scenario analysis I essentially want to import this table and then import it again, but this time have the ability to modify the cash and frequency column. This then has the effect of allowing me to calculate what the costs will be per period. (i.e. P1, P2, P3, P4) as in the image displayed above.
At the moment my thought process is in the excelsheet to have 4 columns, with two of them as input fields, but I am happy to redesign the input data to be more efficient with this. The script that I have used so far is:
inputfield AltCost, AltFreq;
First 4 LOAD Cost,
Frequency,
AltCost,
AltFreq
FROM
C:\Users\Ronald.VanMoere\Desktop\QLikviewWhatif\cashflowtest\testcash.xlsx
(ooxml, embedded labels, header is 1 lines, table is Sheet1);
The idea behind it is that I can display the cashflows graphically while changing the values for the altcost altfreq and there after export the column totals from one table to excel once we have found an optimised cashflow.
Any ideas are welcome.
In the long run I would want to apply this to multiple line items for my life cycle models.
Kind regards, Ronny.
- Mark as New
- Bookmark
- Subscribe
- Mute
- Subscribe to RSS Feed
- Permalink
- Report Inappropriate Content
Thank you Oleg,
Could you please elaborate, by giving an example. Haven't worked with synthetic dimensions as of yet.
Much appreciated, Ronny.
- Mark as New
- Bookmark
- Subscribe
- Mute
- Subscribe to RSS Feed
- Permalink
- Report Inappropriate Content
An example of using synthetic dimensions:
Calculate Dimension: =ValuesList('Cost', 'Alt Cost')
Expression:
IF( ValuesList('Cost', 'Alt Cost') = 'Cost',
<one calculation>
,
<another calculation>
)
cheers,
Oleg
- Mark as New
- Bookmark
- Subscribe
- Mute
- Subscribe to RSS Feed
- Permalink
- Report Inappropriate Content
correction: the function name is ValueList() - without the "s" at the end...