Unlock a world of possibilities! Login now and discover the exclusive benefits awaiting you.
- Qlik Community
- :
- All Forums
- :
- QlikView App Dev
- :
- Re: Compare Previous Data
- Subscribe to RSS Feed
- Mark Topic as New
- Mark Topic as Read
- Float this Topic for Current User
- Bookmark
- Subscribe
- Mute
- Printer Friendly Page
- Mark as New
- Bookmark
- Subscribe
- Mute
- Subscribe to RSS Feed
- Permalink
- Report Inappropriate Content
Compare Previous Data
Hi,
I have been given a tough task of conveying if the introduction of Agency bookings is increasing the number of drivers accepting Journeys....
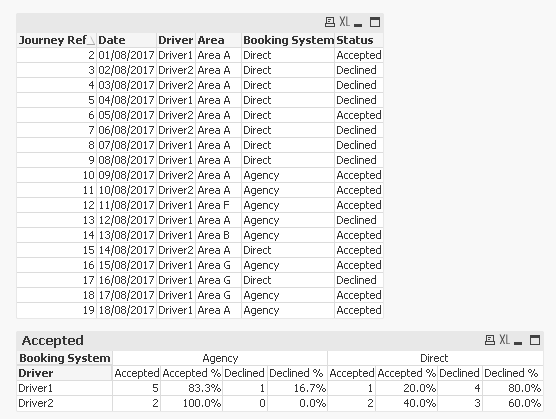
As an example, I have the following dataset :
(in actuality my sensitive dataset has hundreds of drivers and many available journey's per day)
| Journey Ref | Date | Driver | Area | Booking System | Status |
|---|---|---|---|---|---|
| 2 | 01/08/2017 | Driver1 | Area A | Direct | Accepted |
| 3 | 02/08/2017 | Driver2 | Area A | Direct | Declined |
| 4 | 03/08/2017 | Driver2 | Area A | Direct | Declined |
| 5 | 04/08/2017 | Driver1 | Area A | Direct | Declined |
| 6 | 05/08/2017 | Driver2 | Area A | Direct | Accepted |
| 7 | 06/08/2017 | Driver2 | Area A | Direct | Declined |
| 8 | 07/08/2017 | Driver1 | Area A | Direct | Declined |
| 9 | 08/08/2017 | Driver1 | Area A | Direct | Declined |
| 10 | 09/08/2017 | Driver2 | Area A | Agency | Accepted |
| 11 | 10/08/2017 | Driver2 | Area A | Agency | Accepted |
| 12 | 11/08/2017 | Driver1 | Area F | Agency | Accepted |
| 13 | 12/08/2017 | Driver1 | Area A | Agency | Declined |
| 14 | 13/08/2017 | Driver1 | Area B | Agency | Accepted |
| 15 | 14/08/2017 | Driver2 | Area A | Direct | Accepted |
| 16 | 15/08/2017 | Driver1 | Area G | Agency | Accepted |
| 17 | 16/08/2017 | Driver1 | Area G | Direct | Declined |
| 18 | 17/08/2017 | Driver1 | Area G | Agency | Accepted |
| 19 | 18/08/2017 | Driver1 | Area A | Agency | Accepted |
From this I need to determine the followings metrics:
1) Are more drivers working in more Areas who are booked through an agency?
We can see that Driver 1 accepts journeys in 4 different Areas from an Agency compared to 2 different Areas when accepting journeys Direct. Whereas Driver 2 has only worked in 1 Area when accepting Agency journeys.
Need to show whether or not Drivers are working in more areas when accepting Agency journeys (either at a whole fleet level or down to individual driver), eg 'Drivers are accepting 35% more Journeys through an Agency than previously'
2) From the the first time a driver has accepted an Agency Journey are they now accepting more journeys via an Agency than previous Direct journeys?
We can see that that Driver 1 first accepted an Agency Journey on 11/08/2017 and from that point onwards he accepted 3 Agency Journeys in total. On the other hand Driver 2 first accepted an Agency journey on the 09/08/2017 and from that point on he accepted 1 Agency and 1 Direct journey. eg, '78% of Drivers are working in more varied areas than previously'
With this metric, I need to show that once a driver accepts an Agency journey that the ratio of accepted journeys increases over time. Maybe this needs to be per month? to show a full reflection - I don't know.
Would it help if we could pinpoint the introduction of the Agency journeys eg, 09/08/2017 or can that be derived from the dataset....
Any help appreciated as I am completely stumped on this one!
Many thanks,
Phil
- Mark as New
- Bookmark
- Subscribe
- Mute
- Subscribe to RSS Feed
- Permalink
- Report Inappropriate Content
Hi Phil,
Interesting Question.
I try to understand it completely but I couldn't.
maybe stalwar1 can help you 
Thanks
- Mark as New
- Bookmark
- Subscribe
- Mute
- Subscribe to RSS Feed
- Permalink
- Report Inappropriate Content
Hi Mohammed!
Thanks for your reply. Yes - it's beaten me to be honest! Indeed hopefully stalwar1 could help!
Regards,
Tim
- Mark as New
- Bookmark
- Subscribe
- Mute
- Subscribe to RSS Feed
- Permalink
- Report Inappropriate Content
I want to help, but what I am missing here is the kind of display needed. Is this something you would want to see in a straight table or a text box object?
'Drivers are accepting 35% more Journeys through an Agency than previously'
I am not sure if the above statement was made based on the data provided or just a random statement? If this is a random statement, it might help to know what are the actual numbers needed.
I sort of like these challenging questions, but only when I have time to play around with them. If I don't have time, I usually rely on OP to provide the calculation outside of QlikView and then I can provide a QlikView comparable of the same calculation.
- Mark as New
- Bookmark
- Subscribe
- Mute
- Subscribe to RSS Feed
- Permalink
- Report Inappropriate Content
Hi Sunny,
Really appreciate your reply.
It would be great to have both if possible in High Level indicators at the top of the screen with a straight table beneath.
The statement was completely fictional based on the type question could be asked/answered.
Hope this helps in some way..
Phil
- Mark as New
- Bookmark
- Subscribe
- Mute
- Subscribe to RSS Feed
- Permalink
- Report Inappropriate Content
It would be nice, if you can provide actual numbers you need for the high level and straight table for the sample you provided...
- Mark as New
- Bookmark
- Subscribe
- Mute
- Subscribe to RSS Feed
- Permalink
- Report Inappropriate Content
I mean I started like this, but I don't really understand the business logic of your requirement to take you any further. You seem to have some kind of time dimension in your requirement... but unless you provide more details, it might be fishing for me...
- Mark as New
- Bookmark
- Subscribe
- Mute
- Subscribe to RSS Feed
- Permalink
- Report Inappropriate Content
Hi Sunny,
Thanks for your time on this and sorry for the delay in getting back to you. I think my business case is more focused on the impact of when the Agency journeys were introduced and if the number of Journeys taken via the Agency increased.
Also, if possible, an indication that drivers may be going to more varied Areas since the introduction of the Agency.
As mentioned if it helps that we can use a point in time that the Agency was introduced could that help?
I have mocked something up in Excel if that helps :
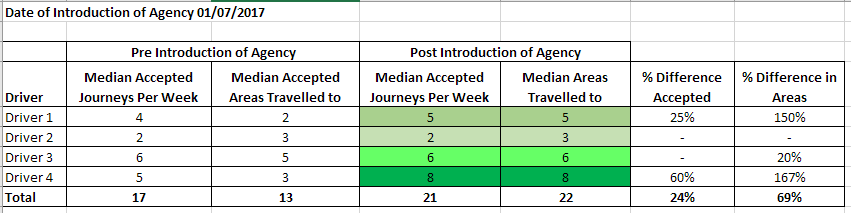
So, from the above we can deduce that since the introduction of the Agency, 24% more journeys have been accepted and 69% more areas have been travelled to... I'd really appreciate it if you can confirm if this sounds right to you and that this example proves this concept?
Once again, thanks for your time.
Phil