Unlock a world of possibilities! Login now and discover the exclusive benefits awaiting you.
- Qlik Community
- :
- All Forums
- :
- QlikView App Dev
- :
- Re: Comparing two tables
- Subscribe to RSS Feed
- Mark Topic as New
- Mark Topic as Read
- Float this Topic for Current User
- Bookmark
- Subscribe
- Mute
- Printer Friendly Page
- Mark as New
- Bookmark
- Subscribe
- Mute
- Subscribe to RSS Feed
- Permalink
- Report Inappropriate Content
Comparing two tables
Hi, I have to tables which should have exactly the same data. I need to find the columns that don’t match base on the same ID. See examples below. Any idea what's the best way to complete this task using qlikview? I'm using QV personal edition, so please explain the method if possible.
Thanks!
Table1
ID | Field1 | Date | Value |
1234 | a14 | 12/13/15 | $1245 |
5677 | r12 | 3/6/15 | $2561 |
2356 | j36 | 2/4/13 | $252 |
Table2
ID | Field1.A | Date.A | Value.A |
1234 | a14 | 12/13/15 | $1245 |
5677 | t36 | 3/16/15 | $2561 |
2356 | j36 | 12/4/13 | $252 |
- Tags:
- chartscript
- « Previous Replies
-
- 1
- 2
- Next Replies »
Accepted Solutions
- Mark as New
- Bookmark
- Subscribe
- Mute
- Subscribe to RSS Feed
- Permalink
- Report Inappropriate Content
But it is only the ID that needs to be a dimension. The Fields can be listed as expressions. The expressions does not need to be measures/metrics but can also be strings. In the example I sent you I didn't use any aggregate function around the field-names and that will work as long as you always have one and only one distinct ID for each row.
- Mark as New
- Bookmark
- Subscribe
- Mute
- Subscribe to RSS Feed
- Permalink
- Report Inappropriate Content
Do you want to do it in the Load Script or in the GUI via a chart and expressions?
- Mark as New
- Bookmark
- Subscribe
- Mute
- Subscribe to RSS Feed
- Permalink
- Report Inappropriate Content
Doing this in a Straight Table should be fairly easy. Make a Straight Table Chart with DImensions of ID, FIeld1, Field1.A, Date, Date.a, Value, Value.A.
The Chart Expression, to limit the chart to only rows that have differences would be:
Field1 <> Field1.A OR Date <> Date/A OR Value <> Value.A
To highlight which fields are different, lick the + next to each Dim and use this for the Background Color.
if(Field1 <> Field1.A, yellow())
etc for the remaining DIms.
-Rob
- Mark as New
- Bookmark
- Subscribe
- Mute
- Subscribe to RSS Feed
- Permalink
- Report Inappropriate Content
No preference. Currently, I'm manually checking in a straight table using expression "if (Field1 = Field1.A,'Y','N')". I'm open to try other better method, either load script or chart expression.
Thanks!
- Mark as New
- Bookmark
- Subscribe
- Mute
- Subscribe to RSS Feed
- Permalink
- Report Inappropriate Content
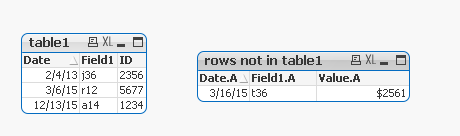
is this the output what you are expecting?
- Mark as New
- Bookmark
- Subscribe
- Mute
- Subscribe to RSS Feed
- Permalink
- Report Inappropriate Content
A Load Script version of it:
Table1:
LOAD * INLINE [
ID, Field1, Date, Value
1234, a14, 13.12.2015, 1245
5677, r12, 6.3.2015, 2561
2356, j36, 4.2.2013, 252
];
JOIN (Table1)
Table2:
LOAD * INLINE [
ID, A.Field1, A.Date, A.Value
1234, a14, 13.12.2015, 1245
5677, t36, 16.3.2015, 2561
2356, j36, 4.12.2013, 252
];
Qualify *;
Result:
LOAD
ID,
If( Field1 <> A.Field1 , Field1 , '') AS Field1,
If ( Date <> A.Date , Date , '' ) AS Date,
If ( Value <> A.Value , Value , '') AS Value,
If( Field1 <> A.Field1 , A.Field1 , '') AS A.Field1,
If ( Date <> A.Date , A.Date , '' ) AS A.Date,
If ( Value <> A.Value , A.Value , '') AS A.Value
RESIDENT
Table1
WHERE
Field1 <> A.Field1
OR Date <> A.Date
OR Value <> A.Value
;
- Mark as New
- Bookmark
- Subscribe
- Mute
- Subscribe to RSS Feed
- Permalink
- Report Inappropriate Content
Hi Rob
In a straight table, is there's a way to reference the column number instead of the actual field name in the expression? I'm thinking an expression like "if( column (2) = column (3),'Y','N') " instead of "if (Field1 = Field1.A,'Y','N')". This way I don’t need to rewrite the expression every time I compare another pair of fields. I actually have a lot of field to compare…. Thanks
Yvonne
- Mark as New
- Bookmark
- Subscribe
- Mute
- Subscribe to RSS Feed
- Permalink
- Report Inappropriate Content
In a Straight Table Chart - Add ID as Dimension and all Six Fields as their Names (just like the column labels on the screen shot:

- Mark as New
- Bookmark
- Subscribe
- Mute
- Subscribe to RSS Feed
- Permalink
- Report Inappropriate Content
Yes you can use an expression exactly like that. There is a function Column(n) where n is the column-number your want to reference...
- Mark as New
- Bookmark
- Subscribe
- Mute
- Subscribe to RSS Feed
- Permalink
- Report Inappropriate Content
Hmmm. But it doesn't work for me, I thought the column(n) is to refer measures only, not for dimension/field, no?
- « Previous Replies
-
- 1
- 2
- Next Replies »