Unlock a world of possibilities! Login now and discover the exclusive benefits awaiting you.
- Qlik Community
- :
- All Forums
- :
- QlikView App Dev
- :
- Conditional coloring of line in a mini chart of a ...
- Subscribe to RSS Feed
- Mark Topic as New
- Mark Topic as Read
- Float this Topic for Current User
- Bookmark
- Subscribe
- Mute
- Printer Friendly Page
- Mark as New
- Bookmark
- Subscribe
- Mute
- Subscribe to RSS Feed
- Permalink
- Report Inappropriate Content
Conditional coloring of line in a mini chart of a staight table
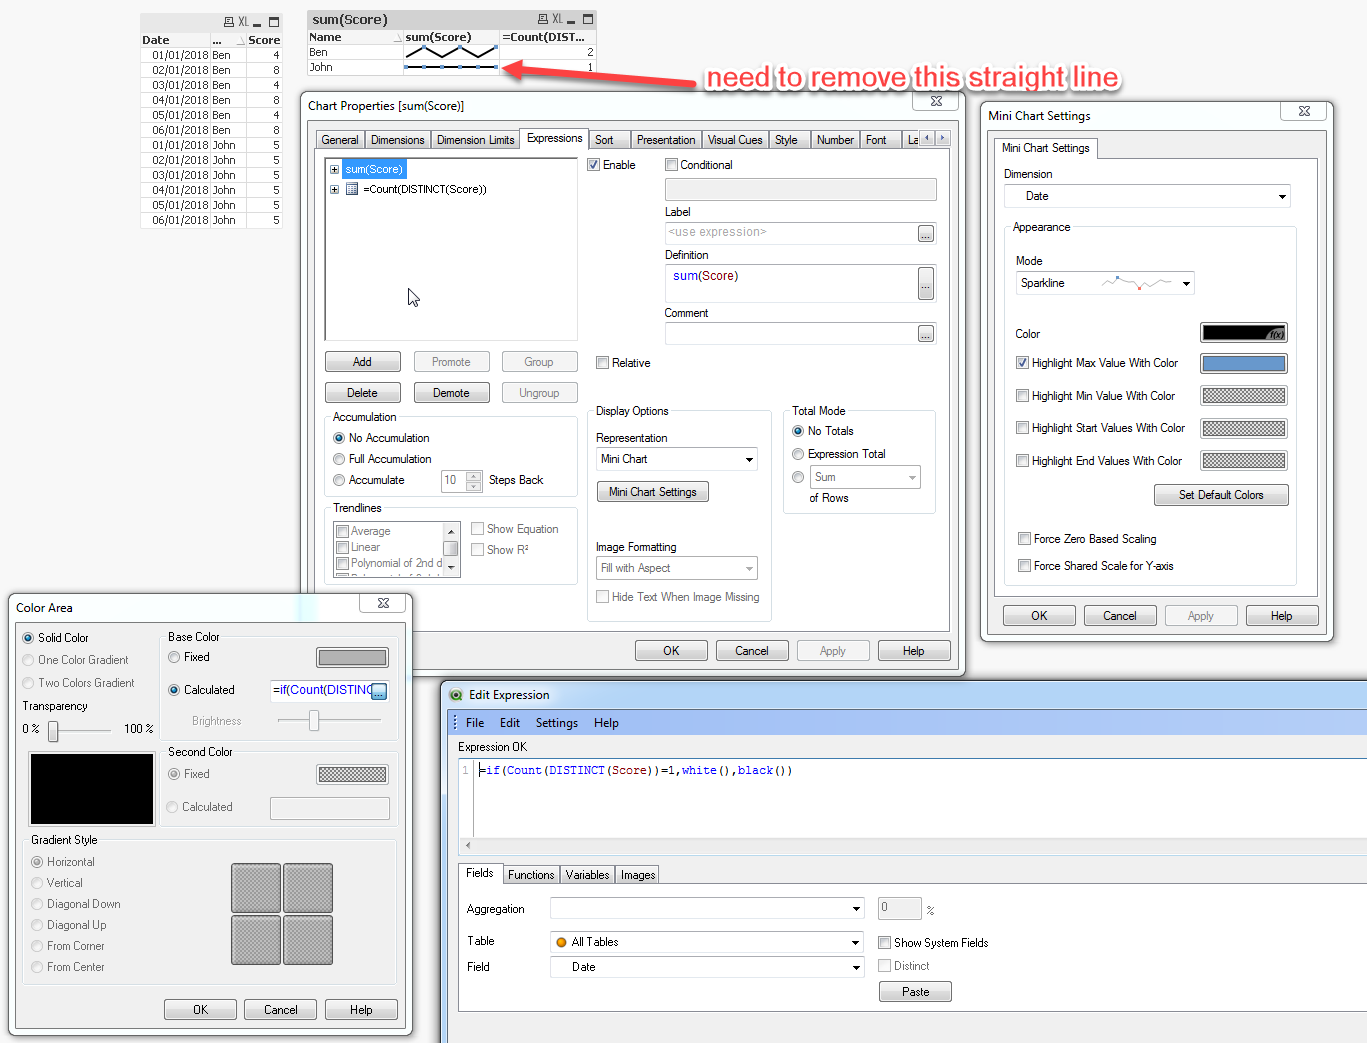
How can a line be transparent or White color in a mini chart if all the data over a period are not changing.
For example Ben score keep changing so I want to the see mini chart for him, but John doe snot change so I do not want to see the mini chart for him at all.
I tried to color the line in white if all data were the same so =if(Count(DISTINCT(Score))=1,white(),black()), but it seemed to be ignored.
Any idea?
Many thanks,
Raphael
- Tags:
- mini chart
- Mark as New
- Bookmark
- Subscribe
- Mute
- Subscribe to RSS Feed
- Permalink
- Report Inappropriate Content
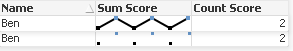
May be use this?
- Mark as New
- Bookmark
- Subscribe
- Mute
- Subscribe to RSS Feed
- Permalink
- Report Inappropriate Content
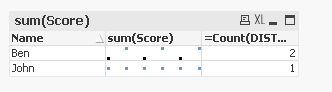
that gave me the above, thanks, but not what I am after - I do not want to see anything for John as John's score is not changing over time - I want to see only a chart for Ben as Ben Score changes over time.
- Mark as New
- Bookmark
- Subscribe
- Mute
- Subscribe to RSS Feed
- Permalink
- Report Inappropriate Content
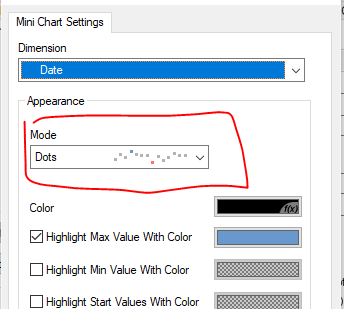
The appearance Dynamic option not there? So, Either you could use 2 charts to build like your achievement
- Mark as New
- Bookmark
- Subscribe
- Mute
- Subscribe to RSS Feed
- Permalink
- Report Inappropriate Content
Hi Raphael,
I believe it would be easier to not output anything when count(distinct(Score) = 1.
So change your expression to:
if(Count(Distinct Score) <= 1, null(),Sum(Score))
- Mark as New
- Bookmark
- Subscribe
- Mute
- Subscribe to RSS Feed
- Permalink
- Report Inappropriate Content
thanks, that make sense, but does not work for me, does it work for you? for me it just does not show anything for both Ben and John.