Unlock a world of possibilities! Login now and discover the exclusive benefits awaiting you.
- Qlik Community
- :
- All Forums
- :
- QlikView App Dev
- :
- Count Distinct Date
- Subscribe to RSS Feed
- Mark Topic as New
- Mark Topic as Read
- Float this Topic for Current User
- Bookmark
- Subscribe
- Mute
- Printer Friendly Page
- Mark as New
- Bookmark
- Subscribe
- Mute
- Subscribe to RSS Feed
- Permalink
- Report Inappropriate Content
Count Distinct Date
I am using the following formula to count distinct days in my data.
- Count(Distinct Date)
I want my count in the above formula to only change when I make a Year, Month, Quarter, Week etc. selection. Example: Year: Count = 365, Month Jan: Count = 31, Week: Count = 7 and so on.
I do not these totals want this to change, if I make a selection in a field that is not a related to a date (Example: Customer). What I want is the count to main the full count of days for date timeframe selected. Example: With the above formula, if I select one Month; then select an attribute of another field within my data that only has one date associate with it, formula is only going to equal 1 when I want it to equal the total days in the Month of 31.
I have tried the following:
Count({1}Distinct Date) - This will only maintain the total distinct dates within the entire file. It won’t change when I select Year, Quarter, Month, Week, etc.
Thanks in advance for your help.
Brian
- Tags:
- count
- set analysis
Accepted Solutions
- Mark as New
- Bookmark
- Subscribe
- Mute
- Subscribe to RSS Feed
- Permalink
- Report Inappropriate Content
Maybe like
COUNT({1<Year = $::Year, Quarter = $::Quarter, Month = $::Month, Week = $::Week>} DISTINCT Date)
- Mark as New
- Bookmark
- Subscribe
- Mute
- Subscribe to RSS Feed
- Permalink
- Report Inappropriate Content
Maybe like
COUNT({1<Year = $::Year, Quarter = $::Quarter, Month = $::Month, Week = $::Week>} DISTINCT Date)
- Mark as New
- Bookmark
- Subscribe
- Mute
- Subscribe to RSS Feed
- Permalink
- Report Inappropriate Content
Try this:
Count({1<Year = p(Year), Month = p(Month), Week = p(Week), Date = p(Date), MonthYear = p(MonthYear), Quarter = p(Quarter)>}Distinct Date)
Add all your Date related field like the above and it should work the way you want it to work.
HTH
Best,
Sunny
- Mark as New
- Bookmark
- Subscribe
- Mute
- Subscribe to RSS Feed
- Permalink
- Report Inappropriate Content
This worked. Thanks swuehi
- Mark as New
- Bookmark
- Subscribe
- Mute
- Subscribe to RSS Feed
- Permalink
- Report Inappropriate Content
Hi swuehi,
The formula you provided works great in a text object but is not working in a Chart Object. The Count is still reflected as the total number of dates associated with each field attribute. Is there an alternative formula that can be used for a Chart Object?
Thanks
Brian
- Mark as New
- Bookmark
- Subscribe
- Mute
- Subscribe to RSS Feed
- Permalink
- Report Inappropriate Content
You want it not to be split across dimensions?
Try the total qualifier:
COUNT({1<Year = $::Year, Quarter = $::Quarter, Month = $::Month, Week = $::Week>} TOTAL DISTINCT Date)
- Mark as New
- Bookmark
- Subscribe
- Mute
- Subscribe to RSS Feed
- Permalink
- Report Inappropriate Content
In the chart you can use this:
COUNT(TOTAL {1<Year = $::Year, Quarter = $::Quarter, Month = $::Month, Week = $::Week>} DISTINCT Date)
- Mark as New
- Bookmark
- Subscribe
- Mute
- Subscribe to RSS Feed
- Permalink
- Report Inappropriate Content
Hi
Are you looking something like below?
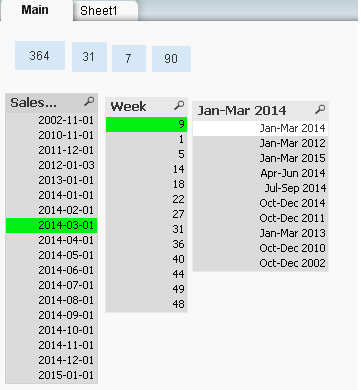
If Yes, you could use the functions
ex:
floor(YearEnd(SalesDate)-YearStart(SalesDate))
ceil(MonthEnd(SalesDate)-MonthStart(SalesDate))
ceil(WeekEnd(SalesDate)-WeekStart(SalesDate))
ceil(QuarterEnd(SalesDate)-QuarterStart(SalesDate))
where SalesDate is your Date Dimension
Hope this helps
- Mark as New
- Bookmark
- Subscribe
- Mute
- Subscribe to RSS Feed
- Permalink
- Report Inappropriate Content
Thanks sunindia
That worked for the Chart
- Mark as New
- Bookmark
- Subscribe
- Mute
- Subscribe to RSS Feed
- Permalink
- Report Inappropriate Content
No Problem 