Unlock a world of possibilities! Login now and discover the exclusive benefits awaiting you.
- Qlik Community
- :
- All Forums
- :
- QlikView App Dev
- :
- Count within Quarter periods using InQuarter () f...
- Subscribe to RSS Feed
- Mark Topic as New
- Mark Topic as Read
- Float this Topic for Current User
- Bookmark
- Subscribe
- Mute
- Printer Friendly Page
- Mark as New
- Bookmark
- Subscribe
- Mute
- Subscribe to RSS Feed
- Permalink
- Report Inappropriate Content
Count within Quarter periods using InQuarter () function?
My main Calendar Dim (Mstr_QuarterYear) is from a Island Calendar so its not linked. based on this post:
I use that for my Quarterly Spread on X axis. Then I want to count or sum up all Opportunities withing that given Quarter
based on the range of Create and Close dates.
Right now it wont display anything. I was hoping this function would make things relatively simple.
No matter what combo of dates I plug in it displays nothing or the count is the same across the entire chart.
Here are two ways I have tried:
If( InQuarter(CreateDate, CloseDate, 0 ), Count(CountOpps) ) Nothing
If( InQuarter(Min(CreateDate), Max(CloseDate), 0 ), Count(CountOpps) ) Shows one bar
InQuarter (date, basedate , shift [, first_month_of_year = 1])
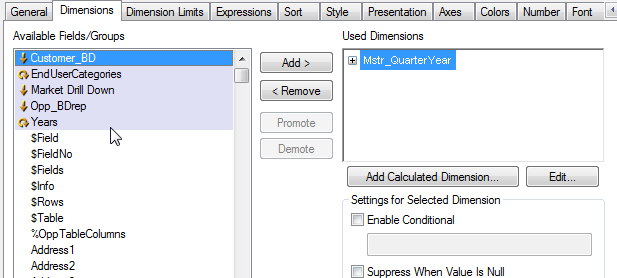
See attached image of Dim tab.
If( Min(CreateDate) < Max(CloseDate),Sum(CountOpps))

- Tags:
- expressions
- inquarter
- Mark as New
- Bookmark
- Subscribe
- Mute
- Subscribe to RSS Feed
- Permalink
- Report Inappropriate Content
Instead of using that try using
Date_Dimensions:
Load Date
Month(Date) as Month,
Week(Date) as Week,
'Q' & Ceil(Month([Date]/3) as Quarter,
Year(Date) as Year
Resident Tablename
where len(LTrim(Date))>0
and then use you expression for aggregation
Hope it helps
- Mark as New
- Bookmark
- Subscribe
- Mute
- Subscribe to RSS Feed
- Permalink
- Report Inappropriate Content
can you explain the logic of this statement: where len(LTrim(Date))>0
Maybe I can crate a flag for each opportunity this active each day until closed?
- Mark as New
- Bookmark
- Subscribe
- Mute
- Subscribe to RSS Feed
- Permalink
- Report Inappropriate Content
means length of the date should be >0(there should be some value present in it)
it wont take empty space