Unlock a world of possibilities! Login now and discover the exclusive benefits awaiting you.
- Qlik Community
- :
- All Forums
- :
- QlikView App Dev
- :
- Create a group in expressions for a line chart
Options
- Subscribe to RSS Feed
- Mark Topic as New
- Mark Topic as Read
- Float this Topic for Current User
- Bookmark
- Subscribe
- Mute
- Printer Friendly Page
Turn on suggestions
Auto-suggest helps you quickly narrow down your search results by suggesting possible matches as you type.
Showing results for
Contributor II
2015-05-20
07:55 AM
- Mark as New
- Bookmark
- Subscribe
- Mute
- Subscribe to RSS Feed
- Permalink
- Report Inappropriate Content
Create a group in expressions for a line chart
Hi,
I have requirement where I need to create a line chart which will show the percentage of Met SLA month & year wise and when I drilldown I should be able to see the Met SLA priority wise (i.e P1,P2...P4) .
Is there a way I can group the Met SLA and Compliance Priority wise?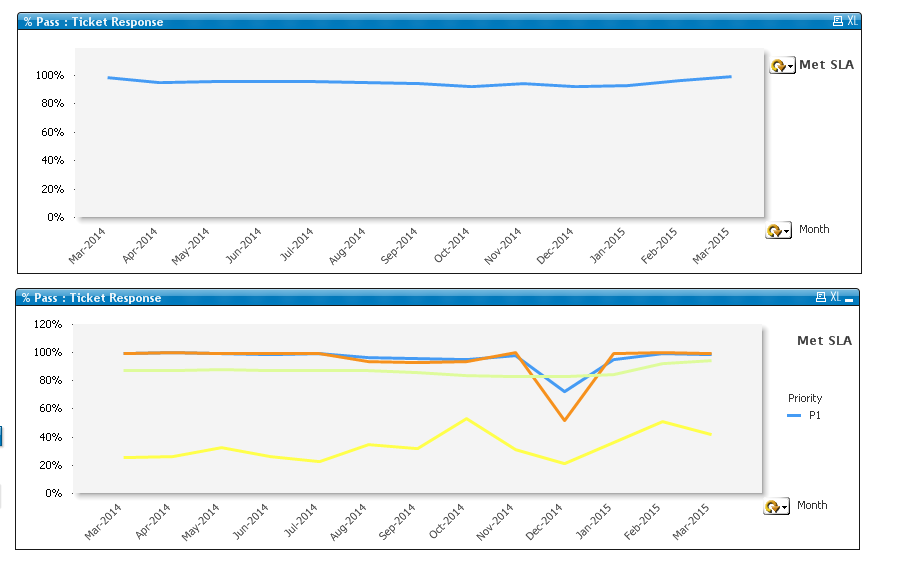
Message was edited by: Mugdha Ojha Added a word document explaining what is my requirement.
969 Views
- « Previous Replies
-
- 1
- 2
- Next Replies »
10 Replies
Contributor III
2018-05-14
05:54 AM
- Mark as New
- Bookmark
- Subscribe
- Mute
- Subscribe to RSS Feed
- Permalink
- Report Inappropriate Content
sorry a bit late ....
wot i do is to use a dimension group using the same filed but with a different label, that way i can get control of IT
hope that helps U
118 Views
- « Previous Replies
-
- 1
- 2
- Next Replies »