Unlock a world of possibilities! Login now and discover the exclusive benefits awaiting you.
- Qlik Community
- :
- All Forums
- :
- QlikView App Dev
- :
- Creating a Bar chart in Qlikview
- Subscribe to RSS Feed
- Mark Topic as New
- Mark Topic as Read
- Float this Topic for Current User
- Bookmark
- Subscribe
- Mute
- Printer Friendly Page
- Mark as New
- Bookmark
- Subscribe
- Mute
- Subscribe to RSS Feed
- Permalink
- Report Inappropriate Content
Creating a Bar chart in Qlikview
I would like to create a bar chart.
I have attached an image of the bar Chart created in Excel.
I want to replicate this chart in Qlikview.
How should I upload the Data? (The P1,P2,P3,P4 and Total Data)?
What do I use as the Dimensions?
What do I use for the Field?
What do I use for the aggregation?
Thanks,
SK
- Mark as New
- Bookmark
- Subscribe
- Mute
- Subscribe to RSS Feed
- Permalink
- Report Inappropriate Content
Hi,
You can upload the data into QV in 2 ways,
1 - If the data is static and you are sure it will not change, you can upload the data using INLINE DATA, by clicking EDIT (ctlr + E) and clicking INSERT > LOAD STATEMENT > LOAD INLINE.
2- If the data is dynamic, always changing it is best to import the data then, click EDIT (ctlr + E) > click TABLE FILE.
One important thing you should do is, to give each column a name then in your dimension use SUM function for the VALUE field.
So say you have named the VALUE field as No. then in the Edit Diemnsion enter SUM(No).
Let me know if this is helpful
Best Regards,
Gabriel
- Mark as New
- Bookmark
- Subscribe
- Mute
- Subscribe to RSS Feed
- Permalink
- Report Inappropriate Content
talk is cheap, supply exceeds demand
- Mark as New
- Bookmark
- Subscribe
- Mute
- Subscribe to RSS Feed
- Permalink
- Report Inappropriate Content
Hi,
I am not sure if I should upload the p1, p2. p3, p4 and total in different fields or do they all need to be in the same field.
Then it asks what fields do I need to add to the dimension. Do I add all of the fields(p1, p2. p3, p4 and total)?
After this it asks for Aggregation and field. I have attached an image of the screen shot to this message.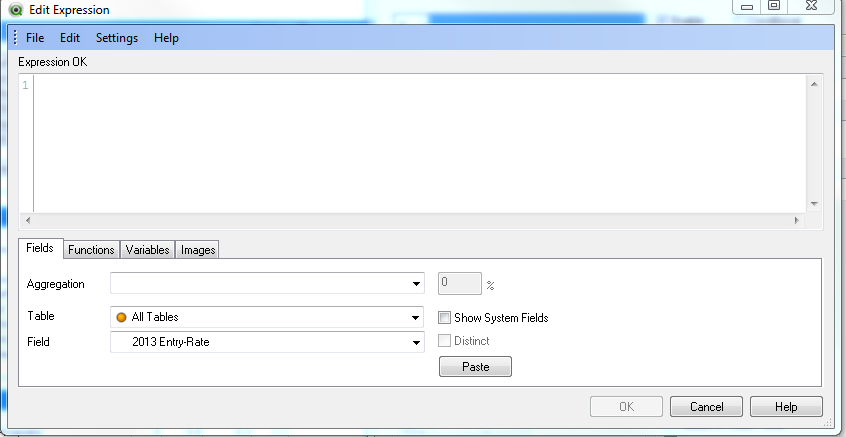
Thanks,
SK
- Mark as New
- Bookmark
- Subscribe
- Mute
- Subscribe to RSS Feed
- Permalink
- Report Inappropriate Content
Hi,
I will suggest you load th p1,p2,p3,p4 and total together in same field and use this field as dimension and use the second field with the numbers as aggregate as in SUM(value field).
Hope this helps
Best Regards,
Gabriel