Unlock a world of possibilities! Login now and discover the exclusive benefits awaiting you.
- Qlik Community
- :
- All Forums
- :
- QlikView App Dev
- :
- Creating a Percent Range for Selection
- Subscribe to RSS Feed
- Mark Topic as New
- Mark Topic as Read
- Float this Topic for Current User
- Bookmark
- Subscribe
- Mute
- Printer Friendly Page
- Mark as New
- Bookmark
- Subscribe
- Mute
- Subscribe to RSS Feed
- Permalink
- Report Inappropriate Content
Creating a Percent Range for Selection
Hi,
I have a chart that looks something like this:
Customer ItemCode Customer Item Qty Customer Percent % Total Item Qty
1 1 100 1.01% 9,900
23 1 1,000 10.10% 9,900
2 2 12,400,000 74.22% 16,708,000
3 2 4,308,000 25.78% 16,708,000
4 5 8,840,000 50.02% 17,673,000
etc.....
Expressions:
Customer Item Qty: =SUM( OrderedQty )
Customer Percent %: = [Customer Item Qty] / [Total Item Qty]
Total Item Qty: =SUM( Total <ItemCode> OrderedQty )
I want the slider object to be a percent range 0% - 100% (1/4 intervals) that allows the user to filter the chart based on the range of percentages selected
For example:
0% 25% 50% 75% 100%
<-----|----------|----------|----------|----------|----->
If the user selects range 25% - 100% then only the last 3 rows of my example should display.
I have tried using max and min variables with set analysis, but haven't been able to figure it out.
Could someone please explain how to do this?
Thanks,
Ben V
- « Previous Replies
-
- 1
- 2
- Next Replies »
Accepted Solutions
- Mark as New
- Bookmark
- Subscribe
- Mute
- Subscribe to RSS Feed
- Permalink
- Report Inappropriate Content
Check if the attached is what you are looking for...
- Mark as New
- Bookmark
- Subscribe
- Mute
- Subscribe to RSS Feed
- Permalink
- Report Inappropriate Content
Check if the attached is what you are looking for...
- Mark as New
- Bookmark
- Subscribe
- Mute
- Subscribe to RSS Feed
- Permalink
- Report Inappropriate Content
Awesome, thanks for the fast response Sunny!
Thanks,
Ben V
- Mark as New
- Bookmark
- Subscribe
- Mute
- Subscribe to RSS Feed
- Permalink
- Report Inappropriate Content
No problem 
- Mark as New
- Bookmark
- Subscribe
- Mute
- Subscribe to RSS Feed
- Permalink
- Report Inappropriate Content
Quick question about your example:
When a narrow selection is made, the totals display ' - ' ...
I know I can change the 'Total Mode' to 'Sum of Rows', which works fine for the Customer Item Qty, but for Total Item Qty it sums every row (summing duplicates) giving a wrong total. (my actual report has many more itemcodes and customers than our example)
How can I get the sum of the Total Item Qty for distinct ItemCodes when such selections are made?
Thanks,
Ben V
- Mark as New
- Bookmark
- Subscribe
- Mute
- Subscribe to RSS Feed
- Permalink
- Report Inappropriate Content
May be try now
- Mark as New
- Bookmark
- Subscribe
- Mute
- Subscribe to RSS Feed
- Permalink
- Report Inappropriate Content

I'm thinking this may not be possible the way I want to do it...
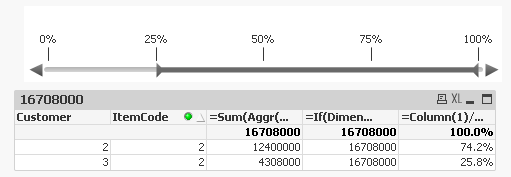
In your example, the second column is the "Total Item Qty" - although it displays values now, I want the total to be 16708000 because that is the Total quantity sold of that item. Is this possible?
Thanks,
Ben V
- Mark as New
- Bookmark
- Subscribe
- Mute
- Subscribe to RSS Feed
- Permalink
- Report Inappropriate Content
Is this what we want?
- Mark as New
- Bookmark
- Subscribe
- Mute
- Subscribe to RSS Feed
- Permalink
- Report Inappropriate Content
Yes!! How did you do that?
Thanks,
Ben V
- Mark as New
- Bookmark
- Subscribe
- Mute
- Subscribe to RSS Feed
- Permalink
- Report Inappropriate Content
I used the Dimensionality() function to use a different expression for the total and a different total for the regular rows.
=If(Dimensionality() = 0,
Sum(Aggr(If(If(Sum(OrderedQty)/Sum(Total <ItemCode> OrderedQty) >= vVarLow and
Sum(OrderedQty)/Sum(Total <ItemCode> OrderedQty) <= vVarHigh,
Sum(OrderedQty)/Sum(Total <ItemCode> OrderedQty)) > 0, Sum(Total <ItemCode> OrderedQty)), ItemCode)),
Sum(Aggr(If(If(Sum(OrderedQty)/Sum(Total <ItemCode> OrderedQty) >= vVarLow and
Sum(OrderedQty)/Sum(Total <ItemCode> OrderedQty) <= vVarHigh,
Sum(OrderedQty)/Sum(Total <ItemCode> OrderedQty)) > 0, Sum(Total <ItemCode> OrderedQty)), Customer, ItemCode)))
- « Previous Replies
-
- 1
- 2
- Next Replies »