Unlock a world of possibilities! Login now and discover the exclusive benefits awaiting you.
- Qlik Community
- :
- All Forums
- :
- QlikView App Dev
- :
- Cululative sum from Mindate to TillDate-5,4,3,2,1
Options
- Subscribe to RSS Feed
- Mark Topic as New
- Mark Topic as Read
- Float this Topic for Current User
- Bookmark
- Subscribe
- Mute
- Printer Friendly Page
Turn on suggestions
Auto-suggest helps you quickly narrow down your search results by suggesting possible matches as you type.
Showing results for
Creator
2015-08-23
09:43 AM
- Mark as New
- Bookmark
- Subscribe
- Mute
- Subscribe to RSS Feed
- Permalink
- Report Inappropriate Content
Cululative sum from Mindate to TillDate-5,4,3,2,1
Hi
I would like to show sum of values in lichart for last 5 days trend.
but my requirement is the sum of value should be from mindate to till date-5,date4-,date-3,date-2,date-1.
How can we achieve this pls provide your suggestions.some thing like attached
Thanks in advance
- Tags:
- swathiraj
495 Views
1 Solution
Accepted Solutions
MVP
2015-08-23
11:27 AM
- Mark as New
- Bookmark
- Subscribe
- Mute
- Subscribe to RSS Feed
- Permalink
- Report Inappropriate Content
296 Views
4 Replies
MVP
2015-08-23
10:33 AM
- Mark as New
- Bookmark
- Subscribe
- Mute
- Subscribe to RSS Feed
- Permalink
- Report Inappropriate Content
Would you be able to share some sample data with your expected output? It isn't very clear what you are trying to do.
Best,
Sunny
296 Views
Creator
2015-08-23
11:08 AM
Author
- Mark as New
- Bookmark
- Subscribe
- Mute
- Subscribe to RSS Feed
- Permalink
- Report Inappropriate Content
Thank you for your reply,
Here is the sample data
Input table:
| Date | Value |
| 7/14/2014 | 100 |
| 9/22/2014 | 80 |
| 10/12/2014 | 130 |
| 1/23/2015 | 150 |
| 4/22/2015 | 100 |
| 6/28/2015 | 120 |
| 8/10/2105 | 70 |
| 8/18/2015 | 50 |
| 8/19/2015 | 50 |
| 8/20/2015 | 300 |
| 8/21/2015 | 120 |
| 8/22/2015 | 140 |
| I want to show line chart for last 5 days Cumulative sum. | |||||
| X axis will have last 5 days dates | |||||
| Output in line chart Values should be like below | |||||
| Column1 | Column2 | (Cumilative value for all above dates) | |||
| 8/18/2015 | 800 | ||||
| 8/19/2015 | 850 | ||||
| 8/20/2015 | 1150 | ||||
| 8/21/2015 | 1270 | ||||
| 8/22/2015 | 1410 | ||||
Thanks
296 Views
MVP
2015-08-23
11:27 AM
- Mark as New
- Bookmark
- Subscribe
- Mute
- Subscribe to RSS Feed
- Permalink
- Report Inappropriate Content
This:
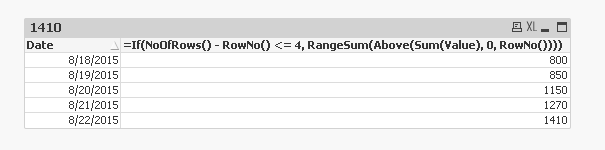
297 Views
MVP
2015-08-23
11:30 AM
- Mark as New
- Bookmark
- Subscribe
- Mute
- Subscribe to RSS Feed
- Permalink
- Report Inappropriate Content
In a line graph:
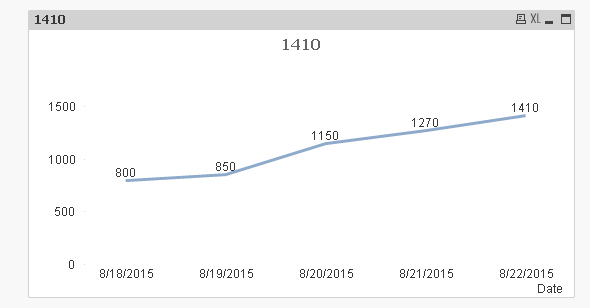
296 Views