Unlock a world of possibilities! Login now and discover the exclusive benefits awaiting you.
- Qlik Community
- :
- All Forums
- :
- QlikView App Dev
- :
- Re: Cumulate values in a Line Chart
- Subscribe to RSS Feed
- Mark Topic as New
- Mark Topic as Read
- Float this Topic for Current User
- Bookmark
- Subscribe
- Mute
- Printer Friendly Page
- Mark as New
- Bookmark
- Subscribe
- Mute
- Subscribe to RSS Feed
- Permalink
- Report Inappropriate Content
Cumulate values in a Line Chart
Hello,
I have a problem with cumulative values in a line chart
I have a table with item, month, production qty and incident qty and i need to calculate the evolution of the production quality.
I have find the solution with rangesum(above)) functions for a simple table chart.
But when i cannot display the same information in a line chart.
You can see the result in the attached file.
First file corrupt, upload a second time
Modified by: Jean-Luc Pache Reload the file
Accepted Solutions
- Mark as New
- Bookmark
- Subscribe
- Mute
- Subscribe to RSS Feed
- Permalink
- Report Inappropriate Content
Solution found in this answer given by swuehl the 15.aug.2013.
http://community.qlik.com/message/379030#379030
Usage of aggr function + "Last, to make this work, you need Date dimension values load order to be sorted chronological (because aggr() function sorts its dimension values only by load order)."
Thanks to swuehl for his help
- Mark as New
- Bookmark
- Subscribe
- Mute
- Subscribe to RSS Feed
- Permalink
- Report Inappropriate Content
Unable to open the attached app, can you check and upload again
- Mark as New
- Bookmark
- Subscribe
- Mute
- Subscribe to RSS Feed
- Permalink
- Report Inappropriate Content
Hi Jean,
Did you try to use build in accumulate function yet? See screenshot below
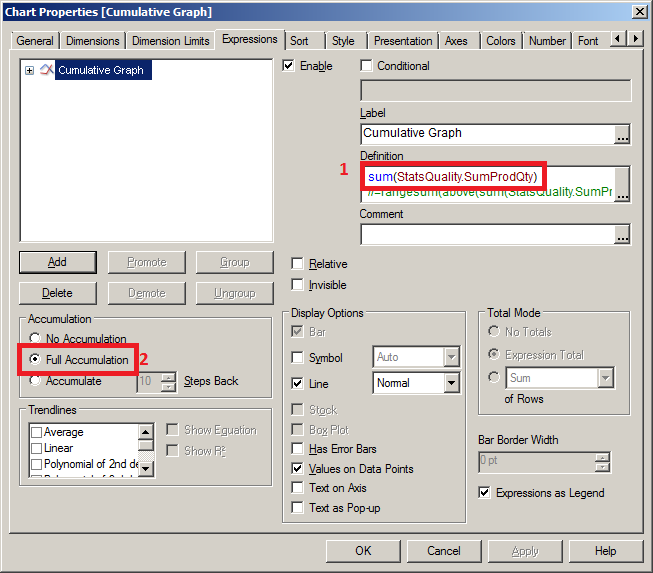
See sample attached file.
Regards,
Sokkorn
- Mark as New
- Bookmark
- Subscribe
- Mute
- Subscribe to RSS Feed
- Permalink
- Report Inappropriate Content
This solution work for the sum of one field but not for the calculation of the percentage
- Mark as New
- Bookmark
- Subscribe
- Mute
- Subscribe to RSS Feed
- Permalink
- Report Inappropriate Content
A lot of views.
But no answer for helping me for the cumulative percentage in my line chart.
- Mark as New
- Bookmark
- Subscribe
- Mute
- Subscribe to RSS Feed
- Permalink
- Report Inappropriate Content
Solution found in this answer given by swuehl the 15.aug.2013.
http://community.qlik.com/message/379030#379030
Usage of aggr function + "Last, to make this work, you need Date dimension values load order to be sorted chronological (because aggr() function sorts its dimension values only by load order)."
Thanks to swuehl for his help