Unlock a world of possibilities! Login now and discover the exclusive benefits awaiting you.
- Qlik Community
- :
- All Forums
- :
- QlikView App Dev
- :
- Current month-1
- Subscribe to RSS Feed
- Mark Topic as New
- Mark Topic as Read
- Float this Topic for Current User
- Bookmark
- Subscribe
- Mute
- Printer Friendly Page
- Mark as New
- Bookmark
- Subscribe
- Mute
- Subscribe to RSS Feed
- Permalink
- Report Inappropriate Content
Current month-1
How can I obtain currentMonth -1 : MonthName(addmonths(max(today()),-1))
Error in the calculated dimension.
I want to obtain : IF today is Février 2012 , I want to obtain Janvier 2012
I create a variable vLastMonth = MonthName(addmonths(max(today()),-1))
Thx,
Accepted Solutions
- Mark as New
- Bookmark
- Subscribe
- Mute
- Subscribe to RSS Feed
- Permalink
- Report Inappropriate Content
Judikael comment #7 -
How would it be possible to have this calculated dimension on one line? I don't think it is.
However, using set analysis in the expressions will allow you to make it look something similar to this...
- Mark as New
- Bookmark
- Subscribe
- Mute
- Subscribe to RSS Feed
- Permalink
- Report Inappropriate Content
Are you trying to obtain data for the prior month, or are you just listing the name in a text box or label?
More details are needed for your inquiry.
Thanks,
Dan
- Mark as New
- Bookmark
- Subscribe
- Mute
- Subscribe to RSS Feed
- Permalink
- Report Inappropriate Content
Dear,
Use the below expression hope it will work for your requirement.
=Date(AddMonths(Today(),-1),'MMM-YYYY')
Thanks,
Mukram
- Mark as New
- Bookmark
- Subscribe
- Mute
- Subscribe to RSS Feed
- Permalink
- Report Inappropriate Content
Thanksbut my real problem is this:
I want to create a calculated dimension with : LastMonth LastYear and CurrentMonth CurrentYear
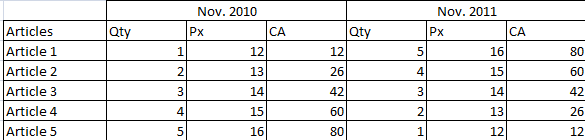
to obtain Two axes in lines : [Last Month LastYear] , [LastMonth-1 LastYear-1] and [Articles]
TCD: Dynamique Cross Tab
in lines [Articles] and in column [LastMonth LastYear] , [LastMonth-1 LastYear-1], Qty, Px, CA
I want to drag [LastMonth LastYear] , [CurrentMonth CurrentYear] in lines to imbricate Qty, Px and CA
Results :
| November 2009 | November 2008 |
Articles | Qty | Px | CA | Qty | Px | CA |
- Mark as New
- Bookmark
- Subscribe
- Mute
- Subscribe to RSS Feed
- Permalink
- Report Inappropriate Content
Calculated dimensions will not work in this case. I would suggest using expressions with set analysis instead. See example below of a chart that I created for our organization...
Thanks,
Dan
- Mark as New
- Bookmark
- Subscribe
- Mute
- Subscribe to RSS Feed
- Permalink
- Report Inappropriate Content
I found this thread via google. I really need an answer to this, myself.
I have a dimension, period start date, and I need it to only show data from the previous month.
What calculated dimension, or what else, will help me achieve this?
- Mark as New
- Bookmark
- Subscribe
- Mute
- Subscribe to RSS Feed
- Permalink
- Report Inappropriate Content
@ Dan
How would you do this? My table name is PeriodStart, could you please help me with a statement?
- Mark as New
- Bookmark
- Subscribe
- Mute
- Subscribe to RSS Feed
- Permalink
- Report Inappropriate Content
Is it possible to obtain this Dynamic Cross Tab in QV ?
- Mark as New
- Bookmark
- Subscribe
- Mute
- Subscribe to RSS Feed
- Permalink
- Report Inappropriate Content
I should have mentioned that I make selections for [GL Fiscal Year] and [GL Fiscal Month], which makes this table much more dynamic.
1st column (Month/Year selected) = Sum([GL Line Amount])
2nd column (Month/Year selected -1 year) =
Sum({$<[GL Fiscal Year]={$(=Only([GL Fiscal Year])-1)}>}[GL Line Amount])
6th column (Year selected totals through month selected or YTD) =
Sum({$<[GL Fiscal Year]={$(=only([GL Fiscal Year]))},
[GL Fiscal Month]={"<=$(=num(only([GL Fiscal Month])))"}>}[GL Line Amount])
12th column (Month/Year selected -1 month) =
Sum({$<[GL Fiscal Year]={$(=Only([GL Fiscal Year]))},
[GL Fiscal Month]={$(#vGL_Fiscal_Mo_To_Num)}>}[GL Line Amount])
**Of course these expresions are a little more complicated than what I have shown, but you should get the idea.
Thanks,
Dan
- Mark as New
- Bookmark
- Subscribe
- Mute
- Subscribe to RSS Feed
- Permalink
- Report Inappropriate Content
Judikael comment #7 -
How would it be possible to have this calculated dimension on one line? I don't think it is.
However, using set analysis in the expressions will allow you to make it look something similar to this...