Unlock a world of possibilities! Login now and discover the exclusive benefits awaiting you.
- Qlik Community
- :
- All Forums
- :
- QlikView App Dev
- :
- Cyclic Dimension
- Subscribe to RSS Feed
- Mark Topic as New
- Mark Topic as Read
- Float this Topic for Current User
- Bookmark
- Subscribe
- Mute
- Printer Friendly Page
- Mark as New
- Bookmark
- Subscribe
- Mute
- Subscribe to RSS Feed
- Permalink
- Report Inappropriate Content
Cyclic Dimension
Hi everyone,
I have several charts in my dashboard. (Almost) all of them have a cyclic dimension in it: Time, that splits Years, into Quaters, into Months.
I would like to have the cyclic-dimension button only ONCE on my tab, instead of in every single chart.
I already managed to remove it from my charts; but right now my users would not be able to change the time-dimension at all.
Can anyone help me with this?
Thanks,
Lina
Accepted Solutions
- Mark as New
- Bookmark
- Subscribe
- Mute
- Subscribe to RSS Feed
- Permalink
- Report Inappropriate Content
Hi Lina,
you can just remove the cyclic group from your charts and replace it by several individual dimensions, with each one becoming active only when a variable you have created befforehand has a specific value.
=> Then you can easily add a button to your sheet to control that variable
=> The button will then control the dimensions in all of your charts simultaneously, so they will all show the same dimension.
I do that always when I have several possible dimensions because the target_group to use my apps is made up of - well, non-techies in any case ...
HTH
best regards,
DataNibbler
- Mark as New
- Bookmark
- Subscribe
- Mute
- Subscribe to RSS Feed
- Permalink
- Report Inappropriate Content
Hello Lisa,
create a table within year, qaurter and month
Show the field in a listbox.
Use the selected value from the listbox as the dynamic dimension on your charts.
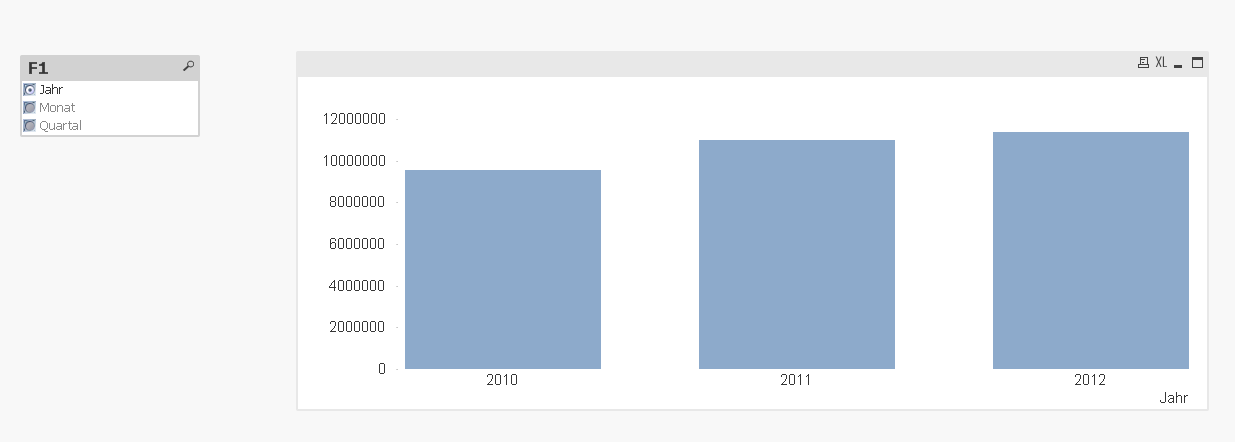

Dimension:

- Mark as New
- Bookmark
- Subscribe
- Mute
- Subscribe to RSS Feed
- Permalink
- Report Inappropriate Content
I encountered a similar problem. All I did was create a blank straight table chart with the same cyclic dimension, then resized it so you could only see the cyclic icon, and put that somewhere else.
I will try to upload a sample qvw if you'd like.
- Mark as New
- Bookmark
- Subscribe
- Mute
- Subscribe to RSS Feed
- Permalink
- Report Inappropriate Content
Check the following thread for some alternatives that are quite nice. Basically your options are:
1. Macro
2. Dynamic Dimension
3. Erik's creative idea the bottom
button to switch dimensions in dimension groups
Kind regards
Niklas
- Mark as New
- Bookmark
- Subscribe
- Mute
- Subscribe to RSS Feed
- Permalink
- Report Inappropriate Content
Dear,
workaround .
find the attached file.

Thanks,
Mukram