Unlock a world of possibilities! Login now and discover the exclusive benefits awaiting you.
- Qlik Community
- :
- All Forums
- :
- QlikView App Dev
- :
- Re: Data Island and Set Analysis
- Subscribe to RSS Feed
- Mark Topic as New
- Mark Topic as Read
- Float this Topic for Current User
- Bookmark
- Subscribe
- Mute
- Printer Friendly Page
- Mark as New
- Bookmark
- Subscribe
- Mute
- Subscribe to RSS Feed
- Permalink
- Report Inappropriate Content
Data Island and Set Analysis
Hi Team -
I have run into a set analysis issue which I have never came across before. I have the following two tables:
Table:
LOAD * Inline [
Dim, Sales
A, 10
B, 20
C, 30
];
IslandTable:
LOAD * Inline [
ABC, XYZ
1ABC, 1
2ABC, 2
3ABC, 3
4ABC, 4
5ABC, 5
];
And lets say I have to use a pivot table using a dimension from the Island Table with set analysis on the Island table fields
1st Attempt (Doesn't work)
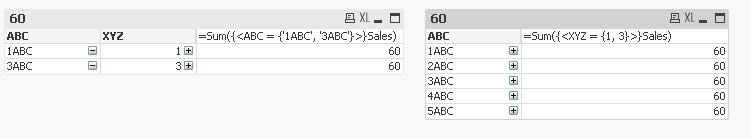
Dimensions: ABC, Dim
Expression: =Sum({<ABC = {'1ABC', '3ABC'}>}Sales)
2nd Attempt (Doesn't work)
Dimensions: ABC, Dim
Expression: =Sum({<XYZ = {1, 3}>}Sales)
In both the above two cases, I hoped to see two rows, but for some reason I saw all ABC

3rd Attempt (Works)
Dimensions: ABC, XYZ, Dim
Expression: =Sum({<ABC = {'1ABC', '3ABC'}>}Sales)
4th Attempt (Works)
Dimensions: ABC, XYZ, Dim
Expression: =Sum({<XYZ = {1, 3}>}Sales)
In my 3rd and 4th attempt, the set analysis starts to work as soon as I add XYZ as dimension (and XYZ is not collapsed)
Is this expected behavior?
swuehl, gwassenaar, mrkachhiaimp, johnw, troyansky, hic, jagan, vinieme12, petter-s, rwunderlich, marcowedel
- « Previous Replies
- Next Replies »
- Mark as New
- Bookmark
- Subscribe
- Mute
- Subscribe to RSS Feed
- Permalink
- Report Inappropriate Content
I'd have expected every one of them to have 5 rows with 60 on each row, which is what we get as long as the first dimension is collapsed on all of them. That much makes sense to me.
Set analysis is evaluated once per chart, not per row. So the first thing QlikView will do with any of these charts is "select" the values for either ABC or XYZ. It will then see which rows of Table are still available from which to sum Sales. All rows of Table are still available. And that's all that set analysis does directly, constrain the rows we use in our aggregation. It doesn't directly constrain the values of our dimensions. So the set analysis should have no effect on any of our results in any of these charts.
And yet it does. At least in charts 3 and 4. And ONLY if we expand them at least one level. So clearly I've misunderstood something, and the collapsed vs. expanded pivot table dimensions should be a big clue what it is.
Someone will surely explain it in a simple way that will make me smack my forehead, but nope, I don't get it. 
- Mark as New
- Bookmark
- Subscribe
- Mute
- Subscribe to RSS Feed
- Permalink
- Report Inappropriate Content
John - I do follow your logic that set analysis is for expression and not for the dimension here, but its just weird that expanding the XYZ dimension resolves the issue.
I guess calculated dimension here might be way to approach this, right?
- Mark as New
- Bookmark
- Subscribe
- Mute
- Subscribe to RSS Feed
- Permalink
- Report Inappropriate Content
Sure, or just a dimension since I have an irrational dislike of calculated dimensions. 
if(match(XYZ,1,3),XYZ) as XYZ13
I do want to figure out what's going on here, though.
- Mark as New
- Bookmark
- Subscribe
- Mute
- Subscribe to RSS Feed
- Permalink
- Report Inappropriate Content
Hi Sunny,
Respect to Seniors,
So, What can we conclude from this? Should we use 'Calculated Dimension' or need to add one more dimension from unrelated tables to get the desired output in the chart?
Regards,
Nitin
- Mark as New
- Bookmark
- Subscribe
- Mute
- Subscribe to RSS Feed
- Permalink
- Report Inappropriate Content
Hi Nitin -
I don't think this discussion in concluded yet. I am still hoping to hear from some of the other experts.
Best,
Sunny
- Mark as New
- Bookmark
- Subscribe
- Mute
- Subscribe to RSS Feed
- Permalink
- Report Inappropriate Content
I looked into you test application Sunny. I find the first two cases (pivot tables) perfectly understandable as there will be a cartesian product between the fields of the two products. What I find hard to understand is why this doesn't happen with the last two pivot tables. Furthermore when clicking around in these two I got some odd behavior that didn't seem entirely consistent. I didn't take full notes and it is hard to reproduce just now. Briefly it was when I expanded and collapsed sometimes I got the full list of all five values in the ABC dimension whereas most of the time I got only two. That happened to both of the pivot tables. Unfortunately I couldn't find a way of reproduce it consistently...
I have recently - the last two years or so avoided using data islands. If I need to do something special in that direction I most often use ValueList() and ValueLoop() to calculate dimension values on-the-fly.
- Mark as New
- Bookmark
- Subscribe
- Mute
- Subscribe to RSS Feed
- Permalink
- Report Inappropriate Content
I think the different behaviour between the collapsed/expanded pivot is caused through an ignoring of the set analysis condition within the collapsed state and by expanding the condition is evaluated against ABC.
Further I wouldn't consider it as inconsistent behaviour or as a bug because it made in my opinion no sense to calculate dimensions from isolated data-islands within one object - the base of them will be always a carthesic product and even quite small datasets could consume all available resources.
What was your origin aim of calculating over isolated data-areas?
- Marcus
- Mark as New
- Bookmark
- Subscribe
- Mute
- Subscribe to RSS Feed
- Permalink
- Report Inappropriate Content
So there were few things in action here
1) I was just wondering if we can remove the use of Pick(Match()) or If by using set analysis. So, here is an updated sample
Table:
LOAD * Inline [
Dim, Sales1, Sales2
A, 10, 20
B, 20, 30
C, 30, 90
];
IslandTable:
LOAD * Inline [
ABC, XYZ
1ABC, 1
2ABC, 2
3ABC, 3
4ABC, 4
5ABC, 5
];
and lets say that when ABC = 1ABC, I want to Sum(Sales1) and When ABC = 3ABC, I want to Sum(Sales2). This is very simple with pick match. But I was wondering if this could be done using set analysis.
=RangeSum(Sum({<ABC = {'1ABC'}>}Sales1), Sum({<ABC = {'3ABC'}>}Sales2))
2) I do need all ABC, but for this particular chart I just need just 2 of the 5 ABC. Again, Pick(Match()) or if would work, but a) I didn't think of them before I posted this questions, b) I wonder why it doesn't work
- Mark as New
- Bookmark
- Subscribe
- Mute
- Subscribe to RSS Feed
- Permalink
- Report Inappropriate Content
Hi Sunny try This
Sum({< ABC = {'1ABC', '3ABC'} >}Aggr(Sales,ABC,Dim))
If a post helps to resolve your issue, please accept it as a Solution.
- « Previous Replies
- Next Replies »