Unlock a world of possibilities! Login now and discover the exclusive benefits awaiting you.
- Qlik Community
- :
- All Forums
- :
- QlikView App Dev
- :
- Re: Data selection for Charts
- Subscribe to RSS Feed
- Mark Topic as New
- Mark Topic as Read
- Float this Topic for Current User
- Bookmark
- Subscribe
- Mute
- Printer Friendly Page
- Mark as New
- Bookmark
- Subscribe
- Mute
- Subscribe to RSS Feed
- Permalink
- Report Inappropriate Content
Data selection for Charts
Hi guys,
following problem:
I want to show the sales revenue of my department in a chart, split up into regions.
I chose a line chart to do so. It gives me one line for each of my three regions.
The problem is that there a revenues that are not assigned to a region (in the data, this field is just empty). How can I include a forth line in my chart, that shows "other region" / "not assigned region"?
I want this chart to be fixed, no matter what region the user selects.
Thanks for your help!
Cheers,
Lina
- Mark as New
- Bookmark
- Subscribe
- Mute
- Subscribe to RSS Feed
- Permalink
- Report Inappropriate Content
To make it fixed, add a {1} SET STATEMENT into each expression in the chart.
EX: change sum(Sales) to sum( {1} Sales) .
(You would do this in both aggregations in any advanced aggr statements as well (IE: sum( aggr(sum(Sales) , Region)) to sum ( {1} aggr( sum ( {1} Sales),Region)) )
Try to enable 'show all values' on the dimensions on the dimension tab to find the blank/missing bucket of values.
- Mark as New
- Bookmark
- Subscribe
- Mute
- Subscribe to RSS Feed
- Permalink
- Report Inappropriate Content
Hi!
Take a look on the attached file!
Regards,
Gabriel
- Mark as New
- Bookmark
- Subscribe
- Mute
- Subscribe to RSS Feed
- Permalink
- Report Inappropriate Content
Hey,
thanks for you responses. Unfortunately it is a little bit more complicated.
I attached a file that hopefully helps demonstrate my point:
- The three regions are not identical to the geographic regions, but are emerging market 1, emerging market 2 and developed markets.
- I want to include the last three rows of data as forth line ("other") on my diagram. These are the values that are not assigned to any of the three markets.
I hope someone can help me.
Thanks,
Lina
- Mark as New
- Bookmark
- Subscribe
- Mute
- Subscribe to RSS Feed
- Permalink
- Report Inappropriate Content
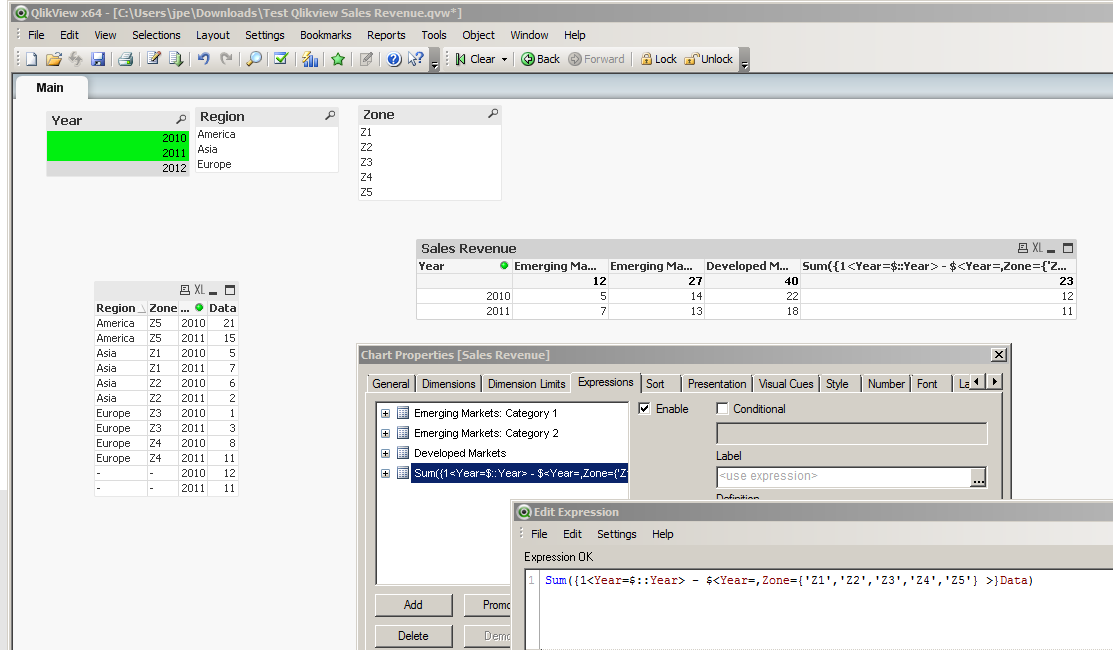
Those extra data values are not associated to region or zone but they are to year.
In that specific scenario , I wrote this to capture them in the chart. But what about other dimensional contexts ? This may need to be tweaked.
Sum({1<Year=$::Year> - $<Year=,Zone={'Z1','Z2','Z3','Z4','Z5'} >}Data)