Unlock a world of possibilities! Login now and discover the exclusive benefits awaiting you.
- Qlik Community
- :
- All Forums
- :
- QlikView App Dev
- :
- Dates on a continuous scale
- Subscribe to RSS Feed
- Mark Topic as New
- Mark Topic as Read
- Float this Topic for Current User
- Bookmark
- Subscribe
- Mute
- Printer Friendly Page
- Mark as New
- Bookmark
- Subscribe
- Mute
- Subscribe to RSS Feed
- Permalink
- Report Inappropriate Content
Dates on a continuous scale
Hi Team,
I have a bar chart with a date as a dimension (x-axis). Currently when I show all of my data, the dates are so crammed up together that they are not visually distinguishable. I want to show all of the data (i.e. not limit and put a scrollbar) but would like to make the step 5 days in stead of every day. The only way I can see to enable the static min, max and step expressions are to use the continuous scale option. This is fine and I can change the step. The issue is that when switching to continuous, the dates are now visualised as date numbers (i.e. 40963) rather than an actual date.
Any ideas?
Thanks
Gareth
- Mark as New
- Bookmark
- Subscribe
- Mute
- Subscribe to RSS Feed
- Permalink
- Report Inappropriate Content
Hi Gareth,
Have you considered using the Date Function to get change from Number to Date format?
Cheers - DV
- Mark as New
- Bookmark
- Subscribe
- Mute
- Subscribe to RSS Feed
- Permalink
- Report Inappropriate Content
Hi Gareth,
Continuous axes only work with numeric values, and since dates are numeric values, the chart represent them as such. But in version 10 SR2 on, at least, you can configure the X-Axis format in the chart properties, Number, "Continuous X-Axis".
Hope that helps.
BI Consultant
- Mark as New
- Bookmark
- Subscribe
- Mute
- Subscribe to RSS Feed
- Permalink
- Report Inappropriate Content
Hi Guys,
I am running 10 SR2 and cannot find this option. I only have the option under Axis> Continuous. The number tab only allows me to change the number formats of Expressions, not dimensions.
Also, the date function makes no difference on the dimension when used...
Is there any other way that you know of? Simple thing really just changing the step of a date scale... another time when QV and dates don't play nice.
Thanks
G
- Mark as New
- Bookmark
- Subscribe
- Mute
- Subscribe to RSS Feed
- Permalink
- Report Inappropriate Content
Hi,
Take a look at the attached application. The data is dummy, but basically I'm loading a date in numeric format and formatting in the chart.
Hope that helps.
BI Consultant
- Mark as New
- Bookmark
- Subscribe
- Mute
- Subscribe to RSS Feed
- Permalink
- Report Inappropriate Content
Hi Miguel Angel Baeyens,
In your example, I did not find how you converted the numbers into date. i.e. then set the Continious porperty, we actually are seeing the dates like Jan 2011, but the underllying field is actually a number. how did this conversion happen? can you please explain?
Thanks,
Srinivas
- Mark as New
- Bookmark
- Subscribe
- Mute
- Subscribe to RSS Feed
- Permalink
- Report Inappropriate Content
Hi Srinivas,
All dates in QlikView are represented by a string, for example 'Feb 8, 2012' although they are interpreted as a number, so you can add a figure to a date, for example, if you use this in a text object, it will return "09/02/2012" which is correct. The reason is that the real value that QlikView stores is numeric.
=Date('08/02/2012' +1)
You can read further about interpretation and representation (among many others) in this post and this thread, along with the Reference Manual.
Hope that helps.
Miguel
- Mark as New
- Bookmark
- Subscribe
- Mute
- Subscribe to RSS Feed
- Permalink
- Report Inappropriate Content
Did you ever find a way to make a date axis continuous but still have it labeled with text?
- Mark as New
- Bookmark
- Subscribe
- Mute
- Subscribe to RSS Feed
- Permalink
- Report Inappropriate Content
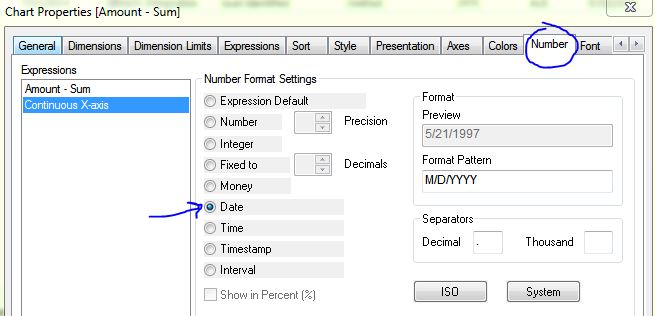
You can make Date continuous and still set the date format you want. You need to
1.) Check Continuous box on the Dimension Axes on the Axes tab.
2.) Set the "Continuous X-axis" expression to Date on the Number tab.
- Mark as New
- Bookmark
- Subscribe
- Mute
- Subscribe to RSS Feed
- Permalink
- Report Inappropriate Content
If only it was that easy. Sadly, QlikView (10.0 and 11.20, anyway) commonly disregards number format in charts - specifically, custom format patterns.