Unlock a world of possibilities! Login now and discover the exclusive benefits awaiting you.
- Qlik Community
- :
- All Forums
- :
- QlikView App Dev
- :
- Dealing with 2 Calendars
- Subscribe to RSS Feed
- Mark Topic as New
- Mark Topic as Read
- Float this Topic for Current User
- Bookmark
- Subscribe
- Mute
- Printer Friendly Page
- Mark as New
- Bookmark
- Subscribe
- Mute
- Subscribe to RSS Feed
- Permalink
- Report Inappropriate Content
Dealing with 2 Calendars
Hi,
I have a qvw that has two datasets each with its own unique calendar.
I have [arrivals_dataset] with an a[rrivals_master_calendar] and a [departures_dataset] with a [departures_master_calendar].
Within the arrivals_dataset I have :
Guest_ID (Key)
Arrival_ID (Key)
Arrival_Date
and other fields
Within the departures_dataset I have :
Guest_ID (Key)
Departure_ID (Key)
Departure_Date
and other fields
Is there any way to create a simple bar chart with a neutral 'Month Year' along the x-axis and show, per month, the total arrivals and total departures. We are trying to capture peak times as we can see that duration of stays vary wildly! I could achieve this in two separate charts based on each independent calendar - but it would be great if we could combine the two.
Any help appreciated!
Phil
- Mark as New
- Bookmark
- Subscribe
- Mute
- Subscribe to RSS Feed
- Permalink
- Report Inappropriate Content
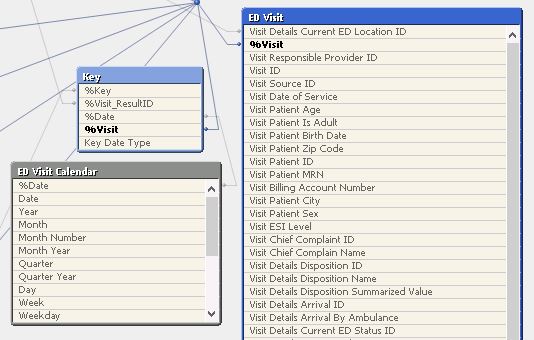
You can achieve this by using a link table and creating a master calendar. In the link table you can have a field with your date_type as Arrival & Departure and use these in your expressions.
Something similar to this