Unlock a world of possibilities! Login now and discover the exclusive benefits awaiting you.
- Qlik Community
- :
- All Forums
- :
- QlikView App Dev
- :
- Decile analysis graphic representation
- Subscribe to RSS Feed
- Mark Topic as New
- Mark Topic as Read
- Float this Topic for Current User
- Bookmark
- Subscribe
- Mute
- Printer Friendly Page
- Mark as New
- Bookmark
- Subscribe
- Mute
- Subscribe to RSS Feed
- Permalink
- Report Inappropriate Content
Decile analysis graphic representation
Hi,
I create a decile graph with the below calculated expression:
=aggr(if(Sum([Net Sales Amount]) <= fractile(TOTAL Aggr(Sum([Net Sales Amount]), [Item Description]), 0.1), 10,
if(Sum([Net Sales Amount]) <= fractile(TOTAL Aggr(Sum([Net Sales Amount]), [Item Description]), 0.2), 9,
if(Sum([Net Sales Amount]) <= fractile(TOTAL Aggr(Sum([Net Sales Amount]), [Item Description]), 0.3), 8,
if(Sum([Net Sales Amount]) <= fractile(TOTAL Aggr(Sum([Net Sales Amount]), [Item Description]), 0.4), 7,
if(Sum([Net Sales Amount]) <= fractile(TOTAL Aggr(Sum([Net Sales Amount]), [Item Description]), 0.5), 6,
if(Sum([Net Sales Amount]) <= fractile(TOTAL Aggr(Sum([Net Sales Amount]), [Item Description]), 0.6), 5,
if(Sum([Net Sales Amount]) <= fractile(TOTAL Aggr(Sum([Net Sales Amount]), [Item Description]), 0.7), 4,
if(Sum([Net Sales Amount]) <= fractile(TOTAL Aggr(Sum([Net Sales Amount]), [Item Description]), 0.8), 3,
if(Sum([Net Sales Amount]) <= fractile(TOTAL Aggr(Sum([Net Sales Amount]), [Item Description]), 0.9), 2,1))))))))),[Item Description])
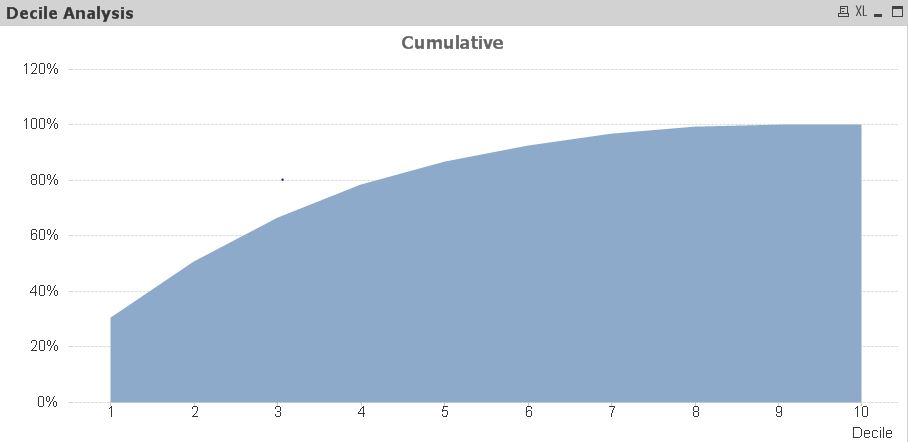
I would like the graphic representation to start from decile 0 Net Sales Amount 0.
- Mark as New
- Bookmark
- Subscribe
- Mute
- Subscribe to RSS Feed
- Permalink
- Report Inappropriate Content
So, you mean to see 0 on the x-axis? Would you be able to share you qvw to look at this?
- Mark as New
- Bookmark
- Subscribe
- Mute
- Subscribe to RSS Feed
- Permalink
- Report Inappropriate Content
Yes, I would like the curve to start at x = 0 and y = 0
- Mark as New
- Bookmark
- Subscribe
- Mute
- Subscribe to RSS Feed
- Permalink
- Report Inappropriate Content
Would you be able to share your qvw file?
- Mark as New
- Bookmark
- Subscribe
- Mute
- Subscribe to RSS Feed
- Permalink
- Report Inappropriate Content
Unfortunately I can;t share the data due to confidentiality.
The graph is as below:
with calculated dim:
=aggr(
if(Sum([Net Sales Amount]) <= fractile(TOTAL Aggr(Sum([Net Sales Amount]), [Item Description]), 0.1), 10,
if(Sum([Net Sales Amount]) <= fractile(TOTAL Aggr(Sum([Net Sales Amount]), [Item Description]), 0.2), 9,
if(Sum([Net Sales Amount]) <= fractile(TOTAL Aggr(Sum([Net Sales Amount]), [Item Description]), 0.3), 8,
if(Sum([Net Sales Amount]) <= fractile(TOTAL Aggr(Sum([Net Sales Amount]), [Item Description]), 0.4), 7,
if(Sum([Net Sales Amount]) <= fractile(TOTAL Aggr(Sum([Net Sales Amount]), [Item Description]), 0.5), 6,
if(Sum([Net Sales Amount]) <= fractile(TOTAL Aggr(Sum([Net Sales Amount]), [Item Description]), 0.6), 5,
if(Sum([Net Sales Amount]) <= fractile(TOTAL Aggr(Sum([Net Sales Amount]), [Item Description]), 0.7), 4,
if(Sum([Net Sales Amount]) <= fractile(TOTAL Aggr(Sum([Net Sales Amount]), [Item Description]), 0.8), 3,
if(Sum([Net Sales Amount]) <= fractile(TOTAL Aggr(Sum([Net Sales Amount]), [Item Description]), 0.9), 2,1))))))))),[Item Description])
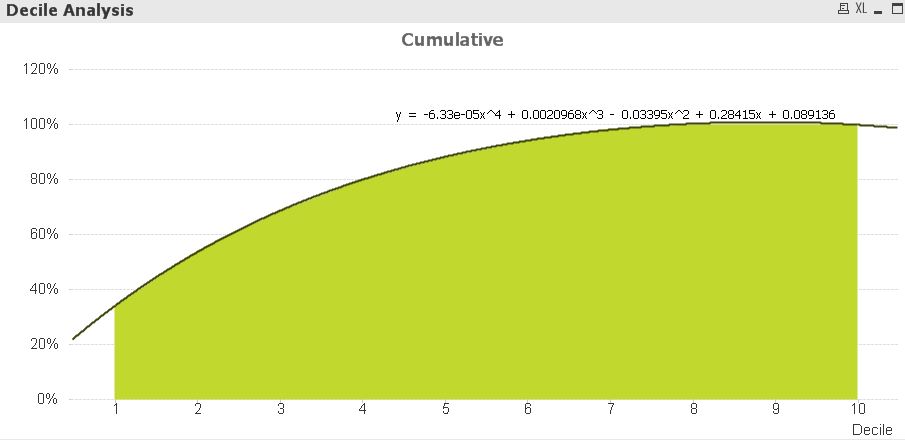
and expression:
RangeSum(Above(TOTAL Sum([Net Sales Amount]), 0, RowNo(TOTAL)))
I would like the green area to star from x=0 and y=0
- Mark as New
- Bookmark
- Subscribe
- Mute
- Subscribe to RSS Feed
- Permalink
- Report Inappropriate Content
Hi
The area is the total sum of your expression minus 1/2 values for 0 and 10:
So indicate sum for expression - 1/2(value at 10
Multiply by 100 if scale 100%
Gini coef?