Unlock a world of possibilities! Login now and discover the exclusive benefits awaiting you.
- Qlik Community
- :
- All Forums
- :
- QlikView App Dev
- :
- Dimension Colours
- Subscribe to RSS Feed
- Mark Topic as New
- Mark Topic as Read
- Float this Topic for Current User
- Bookmark
- Subscribe
- Mute
- Printer Friendly Page
- Mark as New
- Bookmark
- Subscribe
- Mute
- Subscribe to RSS Feed
- Permalink
- Report Inappropriate Content
Dimension Colours
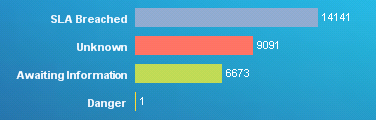
How do I define a colour for a specific dimension in a bar chart ?
eg In the pic below.... I want to define a colour for 'SLA Breached' and for 'Unknown', etc.....
The reason being, sometime 'Unknown' end up as being first in the list, then it takes up the first colour and so on. Now I want it to keep it's colour no matter where in the list it falls.
- Tags:
- chart colours
Accepted Solutions
- Mark as New
- Bookmark
- Subscribe
- Mute
- Subscribe to RSS Feed
- Permalink
- Report Inappropriate Content
in expression click on + sign and then write condition like
pick(Match(Dimension,'SLA Breached','Unknown','Awaiting information','Danger'),color(1),color(2),color(3),Color(4))
you can define these color in color tab.
HTH
Sushil
- Mark as New
- Bookmark
- Subscribe
- Mute
- Subscribe to RSS Feed
- Permalink
- Report Inappropriate Content
Hi Bradley,
Can you upload you sample app we can work on.
Thanks,
V.
- Mark as New
- Bookmark
- Subscribe
- Mute
- Subscribe to RSS Feed
- Permalink
- Report Inappropriate Content
Hi Bradley,
I just tried Sushil Kumar's suggestion
Have a look at attached qvw.
- Mark as New
- Bookmark
- Subscribe
- Mute
- Subscribe to RSS Feed
- Permalink
- Report Inappropriate Content
This is so COOL Sushil.
Thanks man !!! It works. Well done !!!!
Appreciate your help !!!!
- Mark as New
- Bookmark
- Subscribe
- Mute
- Subscribe to RSS Feed
- Permalink
- Report Inappropriate Content
Cheers !!!
there is one shortcut for this:
color(Match(Dimension,'SLA Breached','Unknown','Awaiting information','Danger'))
- Mark as New
- Bookmark
- Subscribe
- Mute
- Subscribe to RSS Feed
- Permalink
- Report Inappropriate Content
Great ! I'll give that a try as well !!