Unlock a world of possibilities! Login now and discover the exclusive benefits awaiting you.
- Qlik Community
- :
- All Forums
- :
- QlikView App Dev
- :
- Display Fields dynamically in straight table
- Subscribe to RSS Feed
- Mark Topic as New
- Mark Topic as Read
- Float this Topic for Current User
- Bookmark
- Subscribe
- Mute
- Printer Friendly Page
- Mark as New
- Bookmark
- Subscribe
- Mute
- Subscribe to RSS Feed
- Permalink
- Report Inappropriate Content
Display Fields dynamically in straight table
Find attached sheet and qvw , When user select opportunity1 then related information should display in straight table , like this user can select opportunity2 and so ..

Field Lvl Trigger : - vVariable1-> = if(InitativeNo='I1', fieldvalue('Initative', 1),if(InitativeNo='I2',fieldvalue('Initative',2)))
vVariable2-> = if(InitativeNo='I1', fieldvalue('InititiavtiveHost',1),if(InitativeNo='I2',fieldvalue('InititiavtiveHost',2)))
vVariable3-> = if(InitativeNo='I1', fieldvalue('InititiavtiveCharges',1),if(InitativeNo='I2',fieldvalue('InititiavtiveCharges',2)))
Sum($(='[' & vVariable3 & ']')) Expression
=num(Sum({<$(='[' & vVariable4 & ']') = {'Review'}>} $(='[' & vVariable3 & ']')),'$#,##0') ( Set with expression)
Thanks in ADV
Vikas
If the issue is solved please mark the answer with Accept as Solution & like it.
If you want to go quickly, go alone. If you want to go far, go together.
- Mark as New
- Bookmark
- Subscribe
- Mute
- Subscribe to RSS Feed
- Permalink
- Report Inappropriate Content
I donot understand, your Chart Looks good, but is missing an expression
so define an Expression e.g. 1, then goto presentation and hide the 1
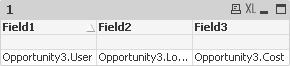
thats what you will see (if you select Opp3)
- Mark as New
- Bookmark
- Subscribe
- Mute
- Subscribe to RSS Feed
- Permalink
- Report Inappropriate Content
Hi Vikas,
Could the attach file answer your question?
Regards
Miguel del Valle