Unlock a world of possibilities! Login now and discover the exclusive benefits awaiting you.
- Qlik Community
- :
- All Forums
- :
- QlikView App Dev
- :
- Display Total partial sum per quarter and end of m...
- Subscribe to RSS Feed
- Mark Topic as New
- Mark Topic as Read
- Float this Topic for Current User
- Bookmark
- Subscribe
- Mute
- Printer Friendly Page
- Mark as New
- Bookmark
- Subscribe
- Mute
- Subscribe to RSS Feed
- Permalink
- Report Inappropriate Content
Display Total partial sum per quarter and end of month
Hi All,
I want to display the total partial sum in a cross table.
e.g. Here is my sample data:
| Year | Month | Quarter | Sales | CATEGORY |
| 2017 | January | 4 | 13000 | A |
| 2017 | February | 4 | 14000 | B |
| 2017 | March | 4 | 15000 | A |
| 2017 | April | 1 | 16000 | B |
| 2017 | May | 1 | 17000 | A |
| 2017 | June | 1 | 18000 | B |
| 2017 | July | 2 | 19000 | A |
| 2017 | August | 2 | 20000 | B |
| 2017 | September | 2 | 21000 | A |
| 2017 | October | 3 | 22000 | B |
| 2017 | November | 3 | 23000 | A |
| 2017 | December | 3 | 24000 | B |
| 2018 | January | 4 | 25000 | A |
| 2018 | February | 4 | 26000 | B |
| 2018 | March | 4 | 27000 | A |
| 2018 | April | 1 | 28000 | B |
| 2018 | May | 1 | 29000 | A |
| 2018 | June | 1 | 30000 | B |
| 2018 | July | 2 | 31000 | A |
| 2018 | August | 2 | 32000 | B |
| 2018 | September | 2 | 33000 | A |
| 2018 | October | 3 | 34000 | B |
| 2018 | November | 3 | 35000 | A |
| 2018 | December | 3 | 36000 | B |
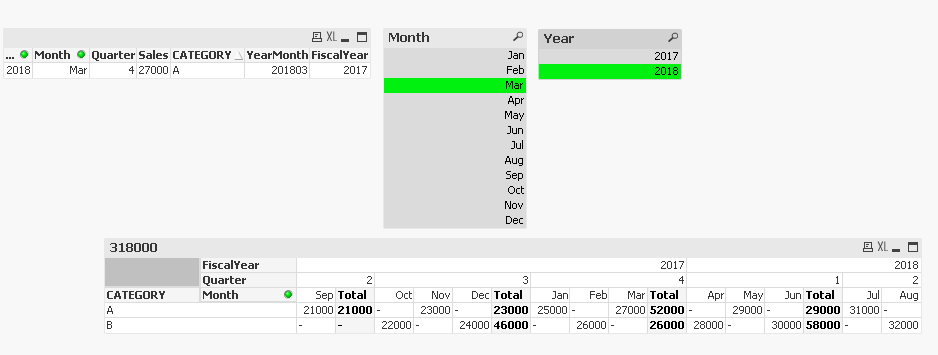
I have selected YEAR=2018 and MONTH=MARCH and it will show me the selected month, the previous 6 months and the next 5 months like so based on my expression:
| Year | Month | Quarter | Sales | CATEGORY |
| 2017 | September | 2 | 21000 | A |
| 2017 | October | 3 | 22000 | B |
| 2017 | November | 3 | 23000 | A |
| 2017 | December | 3 | 24000 | B |
| 2018 | January | 4 | 25000 | A |
| 2018 | February | 4 | 26000 | B |
| 2018 | March | 4 | 27000 | A |
| 2018 | April | 1 | 28000 | B |
| 2018 | May | 1 | 29000 | A |
| 2018 | June | 1 | 30000 | B |
| 2018 | July | 2 | 31000 | A |
| 2018 | August | 2 | 32000 | B |
I need to put it in a cross table like this, where it will get the total for the quarter if whole 3 months (Oct, Nov, Dec; Jan, Feb,Mar) are present and if the last month (Sep) of the quarter is present. But, if it only displays the first 2 months (Jul, Aug) of the quarter, it will not show the total:

I managed to put it in a cross table below, but i'm having a hard time with the total:

Thank you for any help!
- Tags:
- show total
- « Previous Replies
-
- 1
- 2
- Next Replies »
Accepted Solutions
- Mark as New
- Bookmark
- Subscribe
- Mute
- Subscribe to RSS Feed
- Permalink
- Report Inappropriate Content
Try this
=If(SecondaryDimensionality() = 2,
If(Count(TOTAL <FiscalYear, Quarter> DISTINCT {<YearMonth = {"$(='>=' & Date(MonthStart(Max(YearMonth), -6), 'YYYYMM') & '<=' &Date(MonthStart(Max(YearMonth), 5), 'YYYYMM'))"}, Year, Month, Quarter>} YearMonth) <> 3 and
Max(TOTAL <FiscalYear, Quarter> {<YearMonth = {"$(='>=' & Date(MonthStart(Max(YearMonth), -6), 'YYYYMM') & '<=' &Date(MonthStart(Max(YearMonth), 5), 'YYYYMM'))"}, Year, Month, Quarter>} YearMonth) <>
MonthStart(QuarterEnd(Max(TOTAL <FiscalYear, Quarter> {<YearMonth = {"$(='>=' & Date(MonthStart(Max(YearMonth), -6), 'YYYYMM') & '<=' &Date(MonthStart(Max(YearMonth), 5), 'YYYYMM'))"}, Year, Month, Quarter>} YearMonth))), 0,
Sum({<YearMonth = {"$(='>=' & Date(QuarterStart(MonthStart(Max(YearMonth), -6)), 'YYYYMM') & '<=' &Date(MonthStart(Max(YearMonth), 5), 'YYYYMM'))"}, Year, Month, Quarter>}Sales)),
Sum({<YearMonth = {"$(='>=' & Date(MonthStart(Max(YearMonth), -6), 'YYYYMM') & '<=' &Date(MonthStart(Max(YearMonth), 5), 'YYYYMM'))"}, Year, Month, Quarter>}Sales))

- Mark as New
- Bookmark
- Subscribe
- Mute
- Subscribe to RSS Feed
- Permalink
- Report Inappropriate Content
Check this
=If(SecondaryDimensionality() = 2 and Count(TOTAL <FiscalYear, Quarter> DISTINCT {<YearMonth = {"$(='>=' & Date(MonthStart(Max(YearMonth), -6), 'YYYYMM') & '<=' &Date(MonthStart(Max(YearMonth), 5), 'YYYYMM'))"}, Year, Month, Quarter>} YearMonth) <> 3 and
Max(TOTAL <FiscalYear, Quarter> {<YearMonth = {"$(='>=' & Date(MonthStart(Max(YearMonth), -6), 'YYYYMM') & '<=' &Date(MonthStart(Max(YearMonth), 5), 'YYYYMM'))"}, Year, Month, Quarter>} YearMonth) <>
MonthStart(QuarterEnd(Max(TOTAL <FiscalYear, Quarter> {<YearMonth = {"$(='>=' & Date(MonthStart(Max(YearMonth), -6), 'YYYYMM') & '<=' &Date(MonthStart(Max(YearMonth), 5), 'YYYYMM'))"}, Year, Month, Quarter>} YearMonth))), 0,
Sum({<YearMonth = {"$(='>=' & Date(MonthStart(Max(YearMonth), -6), 'YYYYMM') & '<=' &Date(MonthStart(Max(YearMonth), 5), 'YYYYMM'))"}, Year, Month, Quarter>}Sales))
- Mark as New
- Bookmark
- Subscribe
- Mute
- Subscribe to RSS Feed
- Permalink
- Report Inappropriate Content
Hi,
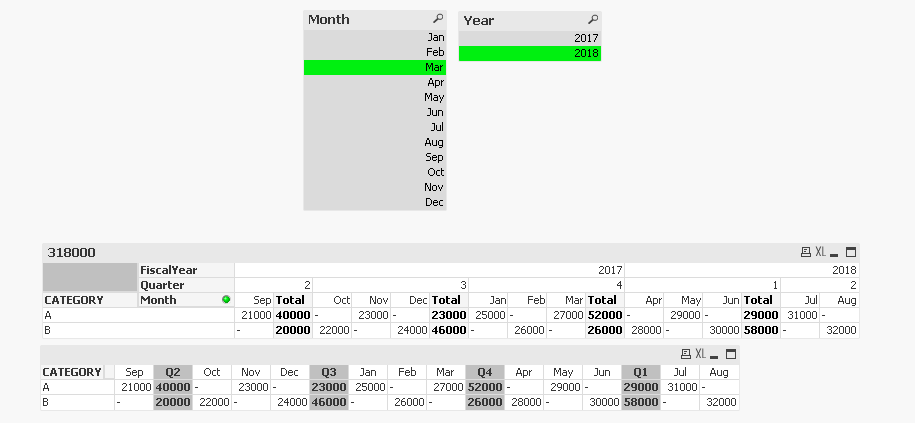
Thank you for your answer. Is it possible for the Q2 total to have the total not only for Sep, but also includes Jul, Aug, & Sep total?
- Mark as New
- Bookmark
- Subscribe
- Mute
- Subscribe to RSS Feed
- Permalink
- Report Inappropriate Content
Try this
=If(SecondaryDimensionality() = 2,
If(Count(TOTAL <FiscalYear, Quarter> DISTINCT {<YearMonth = {"$(='>=' & Date(MonthStart(Max(YearMonth), -6), 'YYYYMM') & '<=' &Date(MonthStart(Max(YearMonth), 5), 'YYYYMM'))"}, Year, Month, Quarter>} YearMonth) <> 3 and
Max(TOTAL <FiscalYear, Quarter> {<YearMonth = {"$(='>=' & Date(MonthStart(Max(YearMonth), -6), 'YYYYMM') & '<=' &Date(MonthStart(Max(YearMonth), 5), 'YYYYMM'))"}, Year, Month, Quarter>} YearMonth) <>
MonthStart(QuarterEnd(Max(TOTAL <FiscalYear, Quarter> {<YearMonth = {"$(='>=' & Date(MonthStart(Max(YearMonth), -6), 'YYYYMM') & '<=' &Date(MonthStart(Max(YearMonth), 5), 'YYYYMM'))"}, Year, Month, Quarter>} YearMonth))), 0,
Sum({<YearMonth = {"$(='>=' & Date(QuarterStart(MonthStart(Max(YearMonth), -6)), 'YYYYMM') & '<=' &Date(MonthStart(Max(YearMonth), 5), 'YYYYMM'))"}, Year, Month, Quarter>}Sales)),
Sum({<YearMonth = {"$(='>=' & Date(MonthStart(Max(YearMonth), -6), 'YYYYMM') & '<=' &Date(MonthStart(Max(YearMonth), 5), 'YYYYMM'))"}, Year, Month, Quarter>}Sales))
- Mark as New
- Bookmark
- Subscribe
- Mute
- Subscribe to RSS Feed
- Permalink
- Report Inappropriate Content
Hi Sunny,
Thank you so much for your answer! it worked well! one more thing, I've tried to hide the Fiscal Year and Quarter column from the pivot table but it seems to mess up the calculation. can i hide the Fiscal Year and Quarter column while retaining the correct values of the table? thanks!
- Mark as New
- Bookmark
- Subscribe
- Mute
- Subscribe to RSS Feed
- Permalink
- Report Inappropriate Content
Like this?
- Mark as New
- Bookmark
- Subscribe
- Mute
- Subscribe to RSS Feed
- Permalink
- Report Inappropriate Content
yes! How did you do that?
- Mark as New
- Bookmark
- Subscribe
- Mute
- Subscribe to RSS Feed
- Permalink
- Report Inappropriate Content
I have already attached the qvw sample with my response above... did you get a chance to look at it?
- Mark as New
- Bookmark
- Subscribe
- Mute
- Subscribe to RSS Feed
- Permalink
- Report Inappropriate Content
yes i have checked it, it works well for me.
- Mark as New
- Bookmark
- Subscribe
- Mute
- Subscribe to RSS Feed
- Permalink
- Report Inappropriate Content
Awesome, I am glad I was able to help
- « Previous Replies
-
- 1
- 2
- Next Replies »