Unlock a world of possibilities! Login now and discover the exclusive benefits awaiting you.
- Qlik Community
- :
- All Forums
- :
- QlikView App Dev
- :
- Display chart axis negative values as ()
- Subscribe to RSS Feed
- Mark Topic as New
- Mark Topic as Read
- Float this Topic for Current User
- Bookmark
- Subscribe
- Mute
- Printer Friendly Page
- Mark as New
- Bookmark
- Subscribe
- Mute
- Subscribe to RSS Feed
- Permalink
- Report Inappropriate Content
Display chart axis negative values as ()
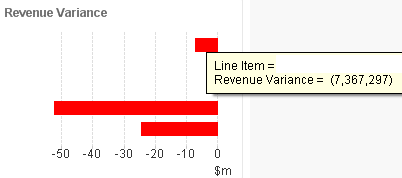
I have a bar chart but I want to display the Axis with () as negative values. I have changed the number format property but that only affects the pop-up value.
Any suggestions? Also is there a way (without /1000000) to display the pop-up in the same number format ($m) as the chart. This is a very inconsistent format for the data. Users can drill down to a very detailed level so hard coding millions is not the right solution.

- Mark as New
- Bookmark
- Subscribe
- Mute
- Subscribe to RSS Feed
- Permalink
- Report Inappropriate Content
On the Number tab of the properties screen select your expression and check Fixed to under Number Format Settings. Set the format pattern to #.##0,00; (#.##0,00)
- Mark as New
- Bookmark
- Subscribe
- Mute
- Subscribe to RSS Feed
- Permalink
- Report Inappropriate Content
Hi. I have tried this but it does not change the Axis values to be in brackets only the values on the popups. The screenshot has your formatting already applied.
- Mark as New
- Bookmark
- Subscribe
- Mute
- Subscribe to RSS Feed
- Permalink
- Report Inappropriate Content
In the chart expression say for eg Sum(Sale)
include number format as
Num(Sum(Sales),#.##0,00; (#.##0,00))