Unlock a world of possibilities! Login now and discover the exclusive benefits awaiting you.
- Qlik Community
- :
- All Forums
- :
- QlikView App Dev
- :
- Display sum of rows from a chart, in a Text Object
- Subscribe to RSS Feed
- Mark Topic as New
- Mark Topic as Read
- Float this Topic for Current User
- Bookmark
- Subscribe
- Mute
- Printer Friendly Page
- Mark as New
- Bookmark
- Subscribe
- Mute
- Subscribe to RSS Feed
- Permalink
- Report Inappropriate Content
Display sum of rows from a chart, in a Text Object
- Mark as New
- Bookmark
- Subscribe
- Mute
- Subscribe to RSS Feed
- Permalink
- Report Inappropriate Content
Hi Andrew,
Try using
sum( Total your expression)
Regards
KC
KC
- Mark as New
- Bookmark
- Subscribe
- Mute
- Subscribe to RSS Feed
- Permalink
- Report Inappropriate Content
Here in this pivot table i m having the issue with the Performance Total it is varying .
It should be Sum([Coperate SLP])*[Performance])
Means (103*106)+(0*111)=109.18 but its displaying as 111 that is the problem over here.
Please Help me guys since a week i m striving to get it done but its not getting perfect.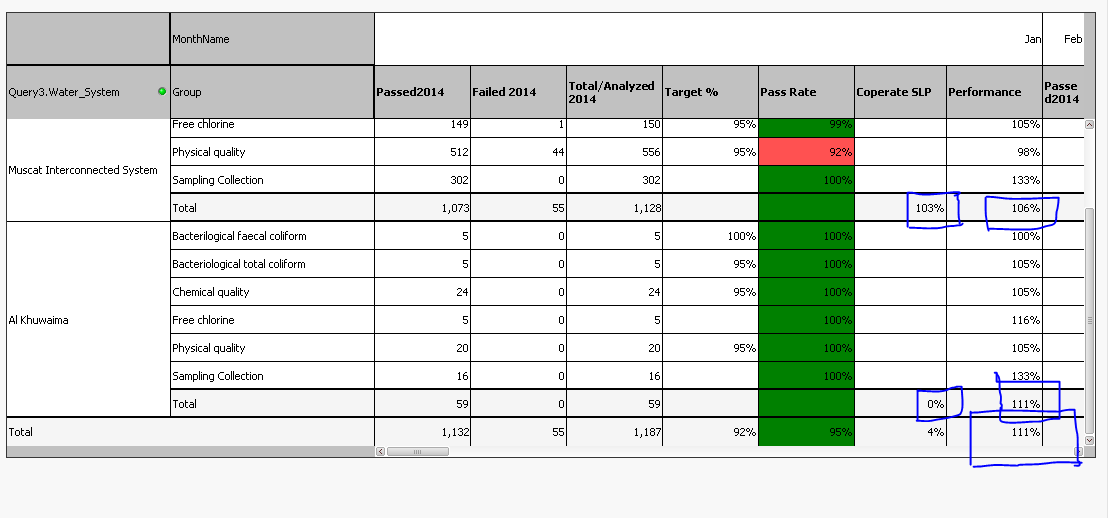
- Mark as New
- Bookmark
- Subscribe
- Mute
- Subscribe to RSS Feed
- Permalink
- Report Inappropriate Content
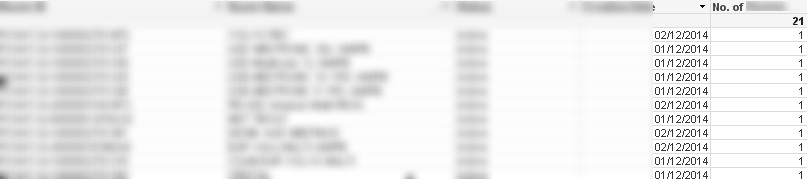
hi
this a classic case for use of aggr function
it should look something like
sum({$<dimension={'<=$(vEndDate)'},dimension={'>=$(vStartDate)'}>}
aggr(max({$<dimension={'<=$(vEndDate)'},dimension={'>=$(vStartDate)'}>}recordCounter),yourdimension1,yourdimension2))
- Mark as New
- Bookmark
- Subscribe
- Mute
- Subscribe to RSS Feed
- Permalink
- Report Inappropriate Content
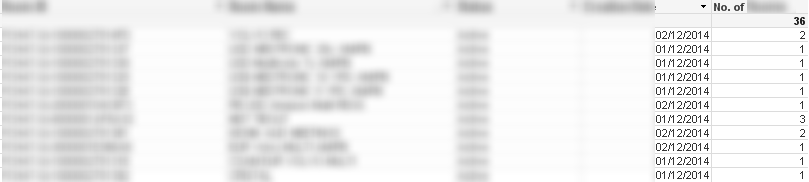
Try
Aggr(sum(distinct{$<dimension={'<=$(vEndDate)'},dimension={'>=$(vStartDate)'}>}recordCounter),Dimension1)
You need to replace the Dimension1 part with a comma seperated list of the dimensions you use in your table