Unlock a world of possibilities! Login now and discover the exclusive benefits awaiting you.
- Qlik Community
- :
- All Forums
- :
- QlikView App Dev
- :
- Display values in line charts with more than 3 exp...
- Subscribe to RSS Feed
- Mark Topic as New
- Mark Topic as Read
- Float this Topic for Current User
- Bookmark
- Subscribe
- Mute
- Printer Friendly Page
- Mark as New
- Bookmark
- Subscribe
- Mute
- Subscribe to RSS Feed
- Permalink
- Report Inappropriate Content
Display values in line charts with more than 3 expressions
Hello everybody!
I have an issue with line charts. Maybe someone of you can help me.
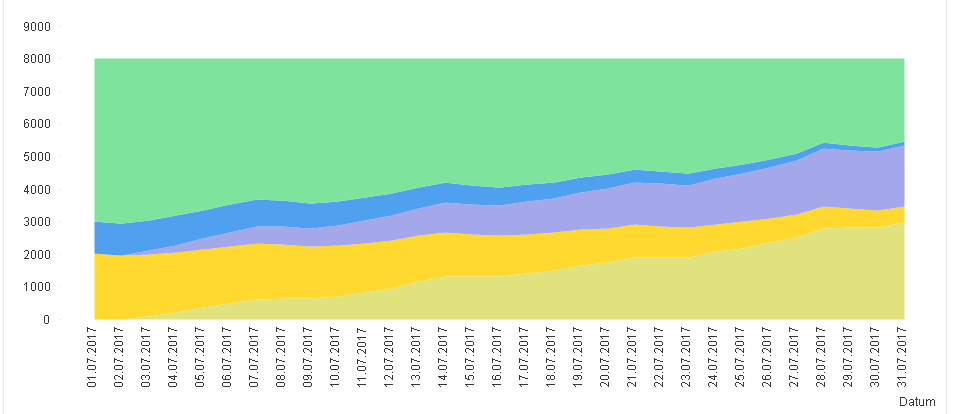
I created a simple line chart, added dimensions and expressionsand checked the "Values on data points" box. Everything is fine unless I add more than 3 expressions. As soon as I add the fourth expression all values disappear in the chart.
Do you have an Idea why the values are no more show when I insert more tha 3 expressions?
Many Thanks,
Michael
- Tags:
- line chart
- Mark as New
- Bookmark
- Subscribe
- Mute
- Subscribe to RSS Feed
- Permalink
- Report Inappropriate Content
Looks like, In your image it has 5 measures and showing all measures in line chart. Can you attach application to test because Line chart has "No limit" Measures
- Mark as New
- Bookmark
- Subscribe
- Mute
- Subscribe to RSS Feed
- Permalink
- Report Inappropriate Content
You are right, it has 5 expressions. I´m sorry, but I can´t attach the application, becuase it contains confidential data....
- Mark as New
- Bookmark
- Subscribe
- Mute
- Subscribe to RSS Feed
- Permalink
- Report Inappropriate Content
Not sure, I follow your issue. But, if you look simply in tabular report initially you May understand each rather line with fulfill style in your case. Will you?