Unlock a world of possibilities! Login now and discover the exclusive benefits awaiting you.
- Qlik Community
- :
- All Forums
- :
- QlikView App Dev
- :
- Displaying empty buckets in class function
- Subscribe to RSS Feed
- Mark Topic as New
- Mark Topic as Read
- Float this Topic for Current User
- Bookmark
- Subscribe
- Mute
- Printer Friendly Page
- Mark as New
- Bookmark
- Subscribe
- Mute
- Subscribe to RSS Feed
- Permalink
- Report Inappropriate Content
Displaying empty buckets in class function
Displaying empty buckets in class function
The above links to the same question raised about a year ago. The reply given then was that class function cannot be used to display empty buckets.
This seriously limits the use of class function in data visualisation, as a histogram drawn using the class function will not correctly show the data distribution.
If the distribution is bimodal with a huge gap in between, this would not be visible at all.
Has this issue since been addressed? is there a viable alternative to bin the data for drawing a histogram, which does not leave out the empty classes?
Regards
Gopinath
Accepted Solutions
- Mark as New
- Bookmark
- Subscribe
- Mute
- Subscribe to RSS Feed
- Permalink
- Report Inappropriate Content
- Mark as New
- Bookmark
- Subscribe
- Mute
- Subscribe to RSS Feed
- Permalink
- Report Inappropriate Content
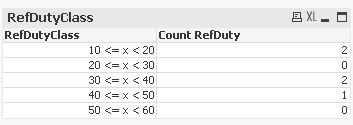
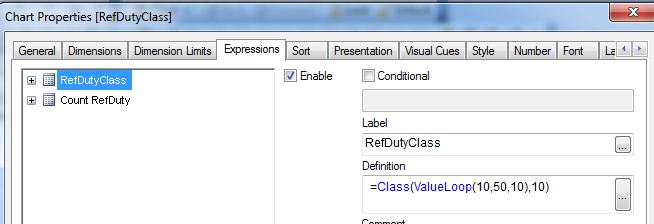
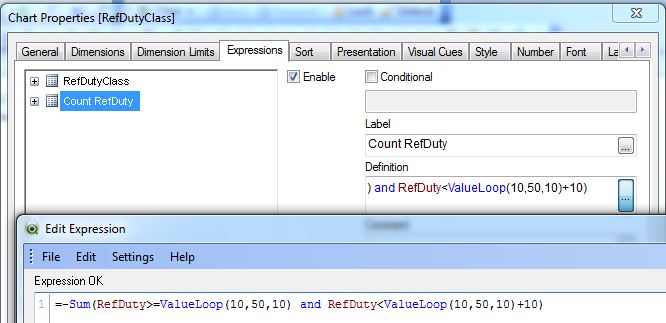
Instead of using Class function to create a Range, you can use If to generate range manually (either in script or as a Calculated Dimension).....
1) This is not a good solution as there could be many lines for the range but as per your requirements and limitation of QlikView class function, this is the only solution..
2) Also, keep in mind that using IF will affect application performance but it will depend on the size of the data
3) There are only 99 If possible in QlikView, so it's difficult to generate more than 100 Range...
Hope this helps....:-)
Happy Qliking![]()
- Mark as New
- Bookmark
- Subscribe
- Mute
- Subscribe to RSS Feed
- Permalink
- Report Inappropriate Content
- Mark as New
- Bookmark
- Subscribe
- Mute
- Subscribe to RSS Feed
- Permalink
- Report Inappropriate Content
Thanks Marco
Works like a charm.
Tried it out with a dataset comprising over 6 million rows.
Only a marginal performance difference from the base class function.
Regards
Gopinath
- Mark as New
- Bookmark
- Subscribe
- Mute
- Subscribe to RSS Feed
- Permalink
- Report Inappropriate Content
Nice to hear.
Please close this thread if there are no further questions.
Thanks
Regards
Marco
- Mark as New
- Bookmark
- Subscribe
- Mute
- Subscribe to RSS Feed
- Permalink
- Report Inappropriate Content
Hi
Would appreciate further assistance on the use of ValueLoop.
While the above example works fine when binning a data element directly, can the same syntax work on bins created by applying class function on aggregate?
Below is the syntax that I tried.
sum( aggr(count(RecID), Data) >=ValueLoop(0,8,2) AND aggr(count(RecID), Data) < ValueLoop(0,8,2)+2)
It gave the correct result for the first bin, but zero for the rest. I understand that AGGR function returns a series of values. Can these be individually accessed in a formula.
Many a times, I need to do stratification/binning after using AGGR function, and am faced with the problem of need to display empty bins.
Regards
Gopinatn


