Unlock a world of possibilities! Login now and discover the exclusive benefits awaiting you.
- Qlik Community
- :
- All Forums
- :
- QlikView App Dev
- :
- Re: Displaying only selected range for cumulative ...
- Subscribe to RSS Feed
- Mark Topic as New
- Mark Topic as Read
- Float this Topic for Current User
- Bookmark
- Subscribe
- Mute
- Printer Friendly Page
- Mark as New
- Bookmark
- Subscribe
- Mute
- Subscribe to RSS Feed
- Permalink
- Report Inappropriate Content
Displaying only selected range for cumulative total
Hi,
Can anybody help me or guide with the following problem.
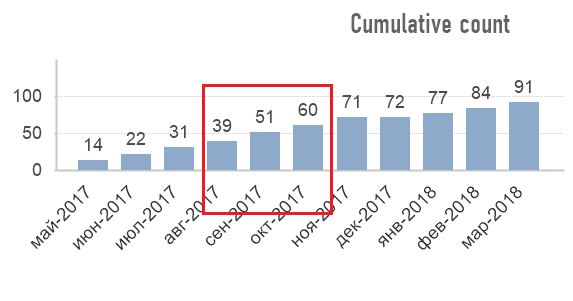
I have a simple bar chart with month-year dimension and expression displaying cumulative total like:
=RangeSum(Above(Count(DISTINCT {$<%DateType={'SpecialDate'}>} %UniqueID), 0, RowNo()))
When I make selection in the month-year pane cumulative total is recalculated. It is correct. But i want to know is it possible to calculate the cumulative data regardless of the month-year (over full set of all the records), but display only selected range? So if i select 3 months (august 2017 - october 2017) there are only 3 values (39, 51, 60) should be represented:
Accepted Solutions
- Mark as New
- Bookmark
- Subscribe
- Mute
- Subscribe to RSS Feed
- Permalink
- Report Inappropriate Content
Try this
=RangeSum(Above(Count(DISTINCT {$<%DateType={'SpecialDate'}, MonthYear>} %UniqueID), 0, RowNo())) * Avg( {$<%DateType={'SpecialDate'}>} 1)
- Mark as New
- Bookmark
- Subscribe
- Mute
- Subscribe to RSS Feed
- Permalink
- Report Inappropriate Content
Try this
=RangeSum(Above(Count(DISTINCT {$<%DateType={'SpecialDate'}, MonthYear>} %UniqueID), 0, RowNo())) * Avg( {$<%DateType={'SpecialDate'}>} 1)
- Mark as New
- Bookmark
- Subscribe
- Mute
- Subscribe to RSS Feed
- Permalink
- Report Inappropriate Content
Thank you, that was helpful:
* Avg({<Дата = {">=$(=$(vStartDateNum))<=$(=$(vEndDateNum))"}>} 1)
but I still don't understand how it works 
- Mark as New
- Bookmark
- Subscribe
- Mute
- Subscribe to RSS Feed
- Permalink
- Report Inappropriate Content
Basically within the rangesum expression... we ignore selection in MonthYear field... which forces it to show everything regardless of selection... but we use Avg(1) to show only those MonthYear... which have been selected... as Avg(1) = 1 for selections and Avg(1) = 0 for out of selection.... So, you accumulation is still intact, but you are just showing the selected MonthYears
- Mark as New
- Bookmark
- Subscribe
- Mute
- Subscribe to RSS Feed
- Permalink
- Report Inappropriate Content
Now much clearer for me. Thank you!