Unlock a world of possibilities! Login now and discover the exclusive benefits awaiting you.
- Qlik Community
- :
- All Forums
- :
- QlikView App Dev
- :
- Re: Re: Displaying single bar chart across all the...
- Subscribe to RSS Feed
- Mark Topic as New
- Mark Topic as Read
- Float this Topic for Current User
- Bookmark
- Subscribe
- Mute
- Printer Friendly Page
- Mark as New
- Bookmark
- Subscribe
- Mute
- Subscribe to RSS Feed
- Permalink
- Report Inappropriate Content
Displaying single bar chart across all the dimensions
Hi All,
I want to display total value for expression in a bar chart across all the dimensions.
When i select dimension the values will be divided across the dimensions but i dont want that to happen.
And also i should able to see values for the dimension only when i select any dimension.
I have attached the QVW.
Please help we with this ASAP.
Thanks in advance,
Keerthi
- « Previous Replies
-
- 1
- 2
- Next Replies »
Accepted Solutions
- Mark as New
- Bookmark
- Subscribe
- Mute
- Subscribe to RSS Feed
- Permalink
- Report Inappropriate Content
Hi Keerti,
Please find the attached application, which may solve your problem:
1. By Default only Expressions will be shown
2. Otherwise, Selected Dimension wise Expressions will be shown.
Hope this helps.
Warm Regards
Rahul
- Mark as New
- Bookmark
- Subscribe
- Mute
- Subscribe to RSS Feed
- Permalink
- Report Inappropriate Content
I am not sure what you are talking about. Your sample chart doesn't use any dimensions, just 4 expressions, so what are the dimensions you are referring to, and how do you get the chart to split up into several bars?
- Mark as New
- Bookmark
- Subscribe
- Mute
- Subscribe to RSS Feed
- Permalink
- Report Inappropriate Content
if I understand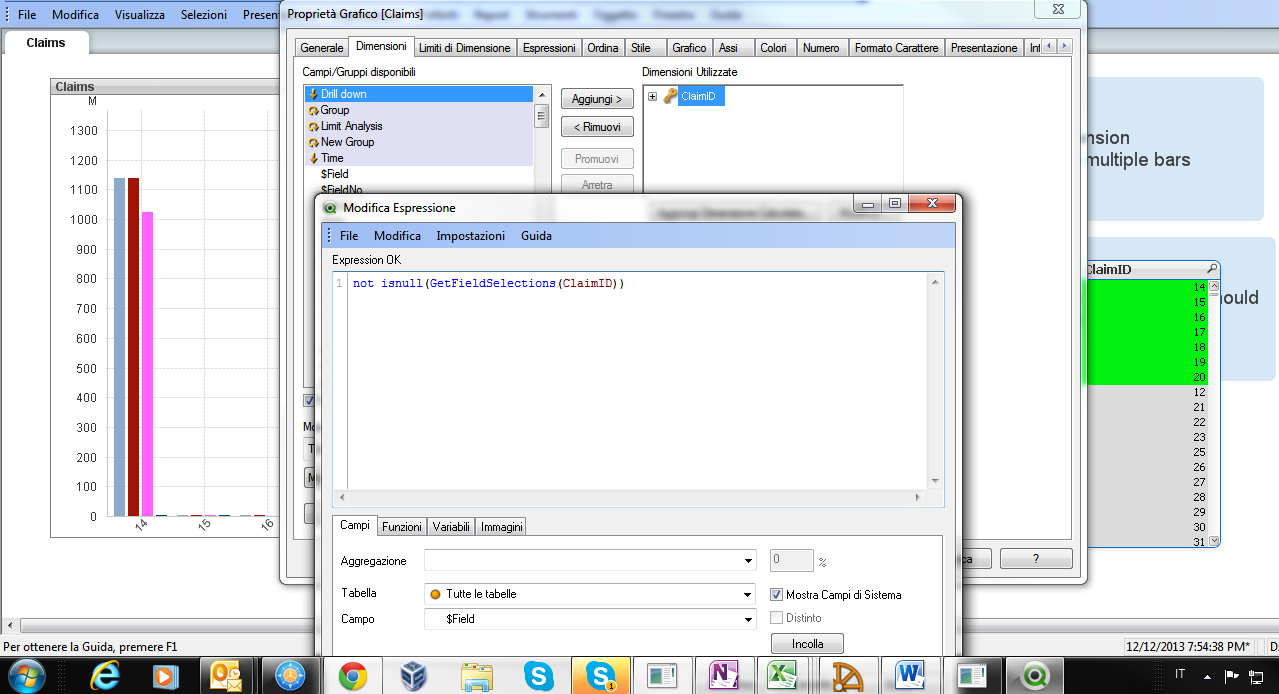
espression in enable conditional for dimension
- Mark as New
- Bookmark
- Subscribe
- Mute
- Subscribe to RSS Feed
- Permalink
- Report Inappropriate Content
Hola keerthi,
Si te entiendo es a que quieres dejar el total de las expresiones y que no lo afecte ningún campo.
Si es esto, existen dos maneras de hacerlo, una es clic derecho en propiedades del objeto -> General, activa la casilla de desvincular y con esto se quedara congelado hasta que lo vincules nuevamente.
La otra, es en la formula incorpora el {1} que significa que dé dará el total y que ignore todo lo demás. Ejemplo sum({1} ows_NetDebtAmount_Total_GBP)
--------------------------------------------------------
if you understand , you wish is to leave full of expressions and do not affect any field.
If it is, there are two ways to do this, either right-click Object Properties -> General, check the box to untie it and stay frozen until you link it again.
The otheris in the formula incorporates the "{1}" which means to give you the total and ignore everything else. Example sum ({1} ows_NetDebtAmount_Total_GBP)
- Mark as New
- Bookmark
- Subscribe
- Mute
- Subscribe to RSS Feed
- Permalink
- Report Inappropriate Content
hi,
Do you want something like this,
Please check the attached file
Regards
Arun Goel
- Mark as New
- Bookmark
- Subscribe
- Mute
- Subscribe to RSS Feed
- Permalink
- Report Inappropriate Content
Hi All,
Actually i want something different.
When i add any dimension to it, data will spread across all the dimensions. But i dont want that to happen. It should show only total of the expression even though dimension is added.
And also when we select any dimension it should show measure only for that dimension.
I have attached the QVW
.
Thanks in advance
Keerthi
- Mark as New
- Bookmark
- Subscribe
- Mute
- Subscribe to RSS Feed
- Permalink
- Report Inappropriate Content
In general, using a dimension will aggregate per this dimension, like a group by in SQL.
http://community.qlik.com/blogs/qlikviewdesignblog/2013/03/25/dimensions-and-measures
http://community.qlik.com/blogs/qlikviewdesignblog/2013/09/09/aggregation-scope
So if you don't want a dimension, don't use one. If you then make a selection, it will calculate the measure using this selection.
So what you want is a chart with no dimension. If you select in your field, it will automatically limit the measure to the selection scope.
You can add an appropriate expression for the chart title to show the scope, total or selection limited.
In your example, the dimension you put into the chart [Underwriter supplying the information], is not connected to the tables with your aggregation field, so you will always see the total value.
I created another chart with a field from the same table, Claim Office, to show how a selection influences the measure.
Check attached.
- Mark as New
- Bookmark
- Subscribe
- Mute
- Subscribe to RSS Feed
- Permalink
- Report Inappropriate Content
Hi Keerthi,
Simply remove dimension from your Dimension list, you will get the Total of all values in Dimension for given expression.
Regards,
Kiran
- Mark as New
- Bookmark
- Subscribe
- Mute
- Subscribe to RSS Feed
- Permalink
- Report Inappropriate Content
But i want the dimensions bcoz when i select it should show only for selected dimension
- Mark as New
- Bookmark
- Subscribe
- Mute
- Subscribe to RSS Feed
- Permalink
- Report Inappropriate Content
Then maybe use two charts, if you want, you can conditionally show / hide them so they appear as one.
- « Previous Replies
-
- 1
- 2
- Next Replies »