Unlock a world of possibilities! Login now and discover the exclusive benefits awaiting you.
- Qlik Community
- :
- All Forums
- :
- QlikView App Dev
- :
- Distinct dimension in grid chart
- Subscribe to RSS Feed
- Mark Topic as New
- Mark Topic as Read
- Float this Topic for Current User
- Bookmark
- Subscribe
- Mute
- Printer Friendly Page
- Mark as New
- Bookmark
- Subscribe
- Mute
- Subscribe to RSS Feed
- Permalink
- Report Inappropriate Content
Distinct dimension in grid chart
Hi everybody,
if I have a data table like this:
DAY, HOUR, VALUES
01/01/2013, 07:00, 12
01/01/2013, 07:30, 18
01/01/2013, 08:00, 115
01/01/2013, 08:30, 82
01/01/2013, 09:00, 91
....
02/01/2013, 07:00, 27
02/01/2013, 07:30, 79
02/01/2013, 08:00, 87
02/01/2013, 08:30, 12
How can I create a grid chart with DAY and HOUR dimensions, with every distinct DAY displayed only once and not repeated??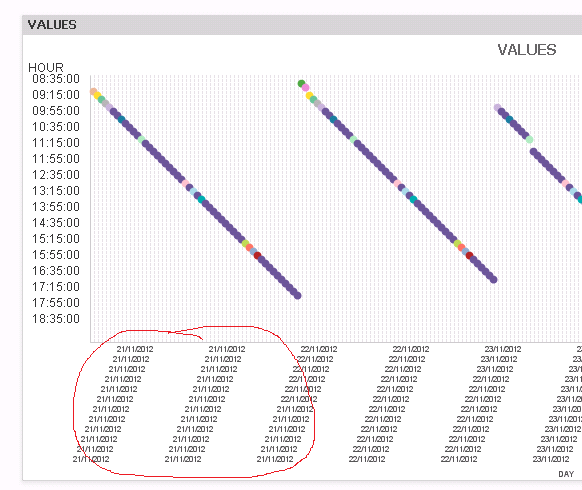
I can not aggregate the distinct values on the chart.
Should be a basic question.
Thanks in advance.
Matteo
Accepted Solutions
- Mark as New
- Bookmark
- Subscribe
- Mute
- Subscribe to RSS Feed
- Permalink
- Report Inappropriate Content
If your data matches the example data in your post, it should automatically group them (see attached).
I'm guessing your data isn't the same as your example and that you have a datetime instead of just a date. Try changing your dimension to:
daystart(DAY)
which should cause all the datetimes for that day to be the same.
- Mark as New
- Bookmark
- Subscribe
- Mute
- Subscribe to RSS Feed
- Permalink
- Report Inappropriate Content
Thanks Nicole,
actually data come from an excel sheet, DAY is displayed as in the example (format DD/MM/YYYY).
Even if I add in the script date# function, days are not grouped. (date#(DAY,'DD/MM/YYYY')).
daystart(DAY) in dimension solves the problem!
Thanks.
Matteo