Unlock a world of possibilities! Login now and discover the exclusive benefits awaiting you.
- Qlik Community
- :
- All Forums
- :
- QlikView App Dev
- :
- Doubts with model: Multiple indicators in a single...
- Subscribe to RSS Feed
- Mark Topic as New
- Mark Topic as Read
- Float this Topic for Current User
- Bookmark
- Subscribe
- Mute
- Printer Friendly Page
- Mark as New
- Bookmark
- Subscribe
- Mute
- Subscribe to RSS Feed
- Permalink
- Report Inappropriate Content
Doubts with model: Multiple indicators in a single column?
Hello people, I'm designing a model to feed a (apparently) simple dashboard but I have some doubt that right now is kind of stopping me.
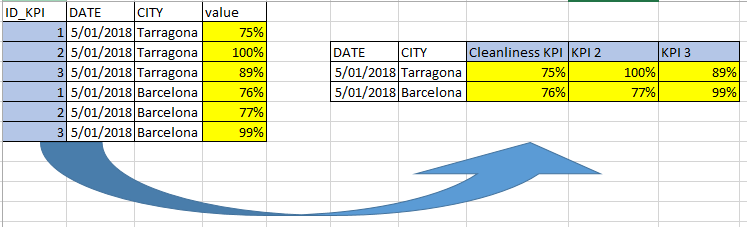
As a summary they send me a single table that contains all the indicators in a single field, for example:
| ID_KPI | DATE | value | |
|---|---|---|---|
| 1 | 05/01/2018 | 75% | |
| 2 | 05/01/2018 | 100% | |
| 3 | 05/01/2018 | 89% | |
| 1 | 06/01/2018 | 76% | |
| 2 |
| 77% | |
| 3 |
| 99% |
This information comes in this way because the indicators are particularized, that is, indicator 1 will calculate, for example, the cleanliness index of Valencia and 2 will calculate it for Barcelona, since they are not calculated in the same way. That is, there will not be a "cleanliness index" indicator that will take different values. This comes from that source and I can not do anything else.
In addition, the dimensional and indicator hierarchy is constructed in such a way that the value of the indicator "cleanliness Index" for Catalonia would not be done as a sum of the "Cleaning Index" of Barcelona, adding the one of Tarragona ... It will be calculated by weightings that are assigned in an external table that tells us the weights: for example, indicator 4, which will be the cleaning index for Catalonia, will be calculated as 60% * Index_Barcelona + 40% * Index_Tarragona. To make things worse, another level change may also have another weight associated, which can also be a combination of already weighted metrics and base metrics.
Initially I constructed the indicators as columns, leaving the basic dimension "City" but this presented two basic problems, the first one is that the calculation of the weighted indicators is quite a big challenge and the other problem is that as new metrics are added we will have more and more columns full of nulls ...
Seeing this, I start thinking that the logical thing to do is to use the model as it comes and precalculate the metrics weighted by Script to load in the last layer only the final data, leaving a fact table with two columns. Regarding the problem of changes in the dimensional level, I have a "bridge" table that specifies at what level an indicator affects.
For example, indicator 1 applies to city, autonomous community and country; but indicator 4, which is a weight, will apply autonomous community level but not city level.
What kind of model do you think I should use? The worst thing that I see in this single-column model is that the representations I make will always have to go through Set Analysis, but calculating the weights is much easier by script than in the final dashboard. What is your opinion?
Thanks in advance!
- Mark as New
- Bookmark
- Subscribe
- Mute
- Subscribe to RSS Feed
- Permalink
- Report Inappropriate Content
Hi Rafael
I'm afraid I find it very difficult to visualise your problem.
One thing that seems to be an issue is the structure of your raw data. It might help to use a Generic load to flip your Indicator-Value combinations into columns with descriptive names. This will make it much easier for visualisations and calculations (especially if some values are 'weights').
A very useful description of Generic Load can be found here: The Generic Load
Hope this helps you.
Duncan