Unlock a world of possibilities! Login now and discover the exclusive benefits awaiting you.
- Qlik Community
- :
- All Forums
- :
- QlikView App Dev
- :
- Dynamic Matrix (Columns, Rows, and data)
- Subscribe to RSS Feed
- Mark Topic as New
- Mark Topic as Read
- Float this Topic for Current User
- Bookmark
- Subscribe
- Mute
- Printer Friendly Page
- Mark as New
- Bookmark
- Subscribe
- Mute
- Subscribe to RSS Feed
- Permalink
- Report Inappropriate Content
Dynamic Matrix (Columns, Rows, and data)
Hello there QlikViewers,
I am new to QlikView
I have a "star-schema" composed of 3 dimensions : Program, PartCategory, and Provider,
and of course a 4th "keys" table which contains the references to each of the 3 dimensions.

Let me first clarify the vocabulary and use examples to explain.
Let's say my company is Porsche : we build cars throughout our plants.
- Each different car model is a "Program" (Boxster, Cayman, 911 Carrera S)
- Every car model is composed of the same generic part categories (Engine, Windshield, Audio System, Brakes)
- A provider is either one of our plants that build parts for specific models, or a supplier (Stuttgart Plant A, Brembo, Bang & Olufsen, Bosch, Munich Plant B)
For 1 Part category for 1 model is associated 1 Provider :
- example 1 : "The WINDSHIELD for our BOXTER is supplied by our MUNICH PLANT B",
- example 2 : "The WINDSHIELD for our CAYMAN is supplied by STUTTGART PLANT A"
- example 3 : "The BRAKES for the PORSCHE 911 CARRERA S is made by our supplier BREMBO"
and so on.
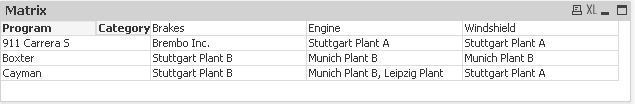
What I would like is a matrix (table) where my columns are the different Part Categories entries (from my PartCategory table)
and the rows are the different Program entries (from my Program table). At the intersection of a Column and Row (example : at the intersection of the "WINDSHIELD" column and the "CAYMAN" row is the Provider : STUTTGART PLANT A)
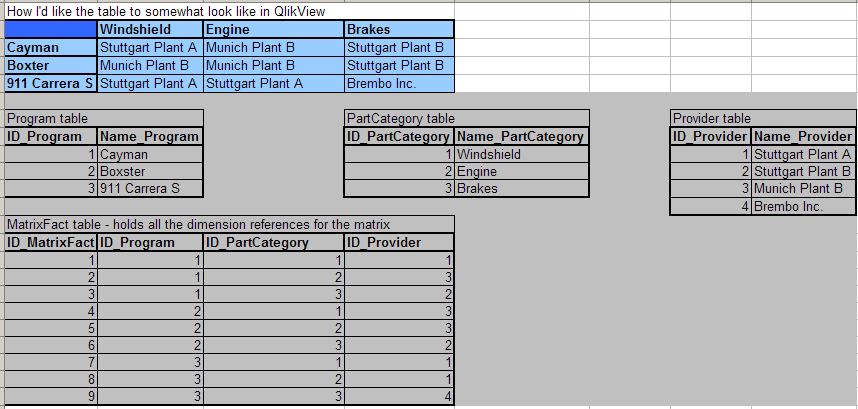
is this possible with QV? Can both the ROWS and COLUMNS be filled with the data from respective tables (and even possibly according to the current selections)?
I hope I was clear enough for you guys, don't hesitate to ask any further questions if you need more explanations or examples
- Tags:
- matrix
- star_schema
Accepted Solutions
- Mark as New
- Bookmark
- Subscribe
- Mute
- Subscribe to RSS Feed
- Permalink
- Report Inappropriate Content
Hi Dominique,
if you cannot rebuild it here we go:
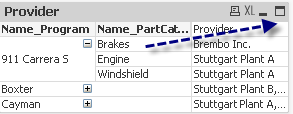
Create a pivot table chart with those two dimesnions:
Name_Program
Name_PartCategory
Add the folowing expression "Provider":
Concat(Name_Provider, ', ', ID_Provider)
Expand the second dimension Name_PartCategory and drag it to the top right as columns until a blue arrow occurs.
- Ralf
- Mark as New
- Bookmark
- Subscribe
- Mute
- Subscribe to RSS Feed
- Permalink
- Report Inappropriate Content
Hi Dominique,
this is possible, but unfortunately not entirely dynamical (see attachment). The Matrix Chart would be the solution, but it can only handle numerical values (as far as I know).
I added another plant (my hometown Leipzig, which has a nice Porsche plant too 😉 to show how it would look if the facts wouldn't be from single occurance.
- Ralf
PS: I would encourage all to post things under the right place. Community corner is related to community issues and questions, not to the products..
- Mark as New
- Bookmark
- Subscribe
- Mute
- Subscribe to RSS Feed
- Permalink
- Report Inappropriate Content
Of course a pivot table can help too.. 😉
- Ralf
- Mark as New
- Bookmark
- Subscribe
- Mute
- Subscribe to RSS Feed
- Permalink
- Report Inappropriate Content
Hello Ralf,
thanks for your quick answers.
Notice that I have moved the thread to the development section  (it was supposed to be there in the first place)
I have the Personal Edition, and it seems you do too.
Is there any way I can open your files without compromising my one and only license ?
- Mark as New
- Bookmark
- Subscribe
- Mute
- Subscribe to RSS Feed
- Permalink
- Report Inappropriate Content
Hi Dominique,
I'm working with a standard version (not PE). Maybe this helps:
Extract the attaches ZIP to the included folder. Create a new QlikView file Porsche_Pivot_new.qvw without any content and save it to the folder above (not the prj folder!). Rename it to Porsche_Pivot.qvw and open it with QlikView.
Then QlikView will recreate the Porsche_Pivot.qvw app (hopefully, never tried this with PE)
- Ralf
- Mark as New
- Bookmark
- Subscribe
- Mute
- Subscribe to RSS Feed
- Permalink
- Report Inappropriate Content
Hi Dominique,
if you cannot rebuild it here we go:
Create a pivot table chart with those two dimesnions:
Name_Program
Name_PartCategory
Add the folowing expression "Provider":
Concat(Name_Provider, ', ', ID_Provider)
Expand the second dimension Name_PartCategory and drag it to the top right as columns until a blue arrow occurs.
- Ralf
- Mark as New
- Bookmark
- Subscribe
- Mute
- Subscribe to RSS Feed
- Permalink
- Report Inappropriate Content
Thank you so much Ralf, this is exactly what I was looking for!
It is much simpler than I thought it would be, I was thinking way too far.
Thanks again and have a nice day
- Dominique
- Mark as New
- Bookmark
- Subscribe
- Mute
- Subscribe to RSS Feed
- Permalink
- Report Inappropriate Content
Thank You so much Ralf,
Great Post.