Unlock a world of possibilities! Login now and discover the exclusive benefits awaiting you.
- Qlik Community
- :
- All Forums
- :
- QlikView App Dev
- :
- Dynamic calculation of difference between values o...
- Subscribe to RSS Feed
- Mark Topic as New
- Mark Topic as Read
- Float this Topic for Current User
- Bookmark
- Subscribe
- Mute
- Printer Friendly Page
- Mark as New
- Bookmark
- Subscribe
- Mute
- Subscribe to RSS Feed
- Permalink
- Report Inappropriate Content
Dynamic calculation of difference between values of different dates
Hi,
I have a counter for each day, and I want to calculate the growth between the selected dates. Thus, the user shall be able to select two dates from a listbox. Is there any way to achieve this, I tried straight table, pivot tables, above function, but cannot get the correct results.
GROWTH is the column I want to receive!
| id | Date | 16-10-13 | 16-10-14 | Growth |
| 1 | 197 | 198 | 1 | |
| 2 | 165 | 167 | 2 | |
| 3 | 358 | 362 | 4 | |
| 4 | 164 | 168 | 4 | |
| 5 | 252 | 255 | 3 | |
| 6 | 234 | 239 | 5 | |
| 7 | 612 | 612 | 0 | |
| 8 | 177 | 181 | 4 | |
| 9 | 190 | 192 | 2 | |
| 10 | - | 4 | 4 |
Accepted Solutions
- Mark as New
- Bookmark
- Subscribe
- Mute
- Subscribe to RSS Feed
- Permalink
- Report Inappropriate Content
- Mark as New
- Bookmark
- Subscribe
- Mute
- Subscribe to RSS Feed
- Permalink
- Report Inappropriate Content
Hi Nihal,
Try with the following expression:
Sum(Aggr(Growth),Date)
Regards.
- Mark as New
- Bookmark
- Subscribe
- Mute
- Subscribe to RSS Feed
- Permalink
- Report Inappropriate Content
Sorry, that was misleading. Growth is the output column I want to receive.
- Mark as New
- Bookmark
- Subscribe
- Mute
- Subscribe to RSS Feed
- Permalink
- Report Inappropriate Content
What are the two dates which are selected? 16-10-13 and 16-10-14? How does the raw data looks like? Would you be able to provide a sample where we can play around with this?
- Mark as New
- Bookmark
- Subscribe
- Mute
- Subscribe to RSS Feed
- Permalink
- Report Inappropriate Content
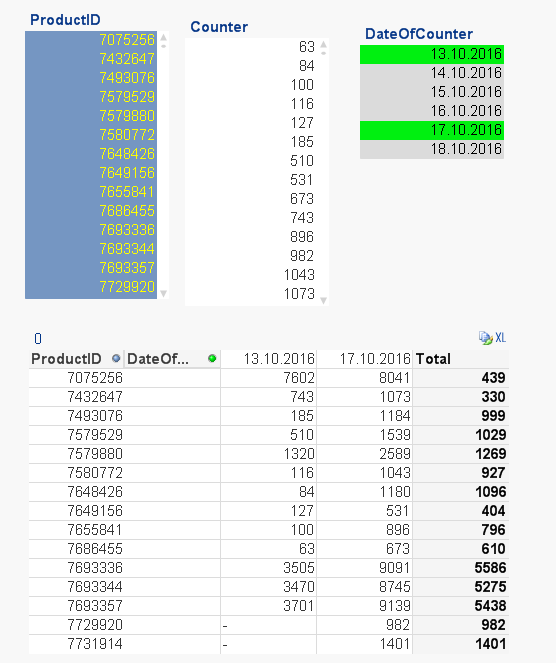
Hi, here is the raw data file. The user shall e.g. select 13.10.2016 and 17.10.2016 and I want to compute the grwoth (delta) between those dates.
- Mark as New
- Bookmark
- Subscribe
- Mute
- Subscribe to RSS Feed
- Permalink
- Report Inappropriate Content
Hi, has anyone a suggestion? I still cannot figure it out.
- Mark as New
- Bookmark
- Subscribe
- Mute
- Subscribe to RSS Feed
- Permalink
- Report Inappropriate Content
Are you looking to get this?
- Mark as New
- Bookmark
- Subscribe
- Mute
- Subscribe to RSS Feed
- Permalink
- Report Inappropriate Content
That was exactly what I was looking for. I need to study for solution though. Thank you Sunny!
- Mark as New
- Bookmark
- Subscribe
- Mute
- Subscribe to RSS Feed
- Permalink
- Report Inappropriate Content
This will sort of only work when you have made two selections, is there a possibility for more than two selection? How would the output look like in that case?