Unlock a world of possibilities! Login now and discover the exclusive benefits awaiting you.
- Qlik Community
- :
- All Forums
- :
- QlikView App Dev
- :
- Dynamic visualization
- Subscribe to RSS Feed
- Mark Topic as New
- Mark Topic as Read
- Float this Topic for Current User
- Bookmark
- Subscribe
- Mute
- Printer Friendly Page
- Mark as New
- Bookmark
- Subscribe
- Mute
- Subscribe to RSS Feed
- Permalink
- Report Inappropriate Content
Dynamic visualization
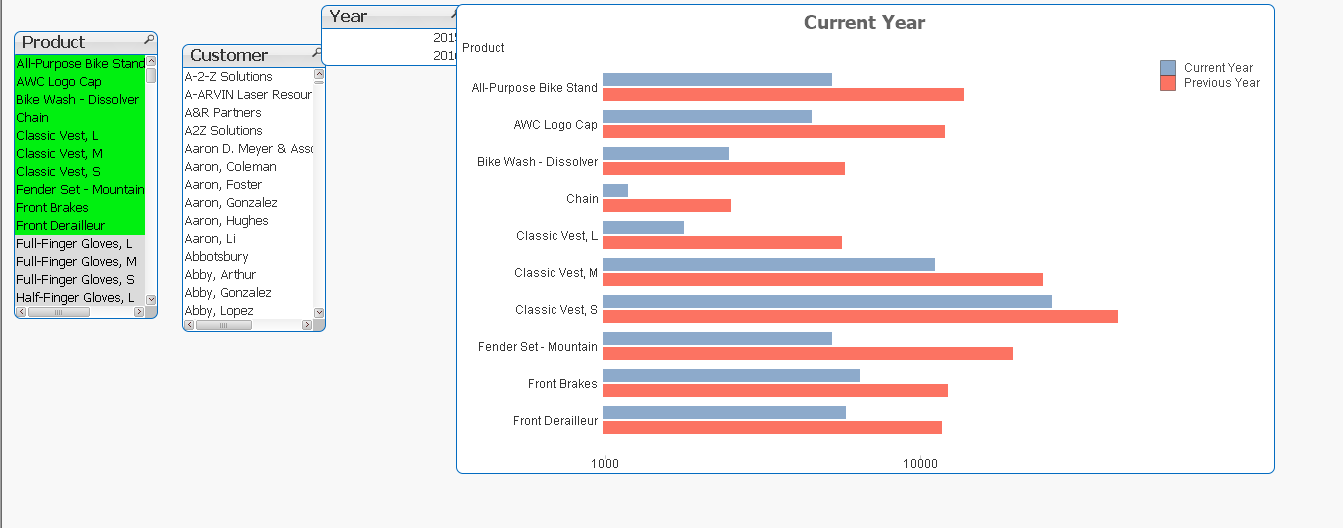
I have a list of products and their Sales for two years.
I want show current year and previous year sales as shown in below picture.
all filters should reflect on these.
This should be dynamic for all filters.i.e if I click on a country, if that country is associated with 20 products then it should show 20 boxes as shown in the image. I mean to say these should change dynamically for all the filters. so there is no chance of using a text box.
In Place of Image in that box I wanted to use a image of that product(Something like bundle load or any other.).
Please suggest me any ideas you have.
Thank you
- Mark as New
- Bookmark
- Subscribe
- Mute
- Subscribe to RSS Feed
- Permalink
- Report Inappropriate Content
HI,
Have a look at the link below for help.
Getting the most out of a Trellis bar chart, some tricks
Regards,
Kaushik Solanki
- Mark as New
- Bookmark
- Subscribe
- Mute
- Subscribe to RSS Feed
- Permalink
- Report Inappropriate Content
Hi,
Can you Please Elaborate your Requirement ,By Providing the pictures as you mentioned!
Is this you want to see as a Chart ,
HTH,
PFA,
Hirish
“Aspire to Inspire before we Expire!”