Unlock a world of possibilities! Login now and discover the exclusive benefits awaiting you.
- Qlik Community
- :
- All Forums
- :
- QlikView App Dev
- :
- Eh?! Pivot Table Total <> Straight Table Total
- Subscribe to RSS Feed
- Mark Topic as New
- Mark Topic as Read
- Float this Topic for Current User
- Bookmark
- Subscribe
- Mute
- Printer Friendly Page
- Mark as New
- Bookmark
- Subscribe
- Mute
- Subscribe to RSS Feed
- Permalink
- Report Inappropriate Content
Eh?! Pivot Table Total <> Straight Table Total
Hi All,
I'm at a bit of a loss here!
I have created a straight table, with various formulas and fields, and its adding up perfectly.
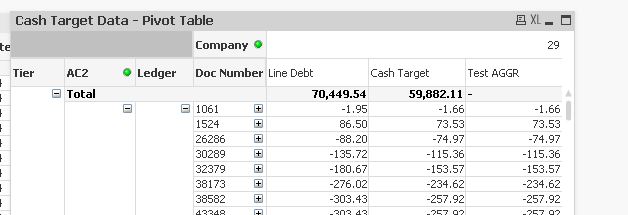
However, when I change the type to a pivot table, to group, it changes all the 'Grand' totals to a totally different figure, even though the lines within the table are showing the correct values. I've exported the pivot to excel, and added it up that way, so I know the 'Grand Total' is wrong.
Any thoughts on the problem?
Have attached JPG image to show problem
Thanks
Di
- « Previous Replies
-
- 1
- 2
- Next Replies »
Accepted Solutions
- Mark as New
- Bookmark
- Subscribe
- Mute
- Subscribe to RSS Feed
- Permalink
- Report Inappropriate Content
Hi Diane,
Use AGGR in expression to Calculate correct grand Total,
For ex. I have 2 Dimensions in pivot table DIM1 and DIM2 and 1 measure Qty.
=AGGR(Sum(Qty),DIM1,DIM2)
Note: Include all dimension in AGGR function those are used in pivot table.
Regards,
Kiran
8976977897
- Mark as New
- Bookmark
- Subscribe
- Mute
- Subscribe to RSS Feed
- Permalink
- Report Inappropriate Content
Hi Diane,
you have probably selected the 'sum of rows' within the straight table, where as the total in the pivot is the expression total. These two things can give different results depending on your data model.
For instance if you have a dimension table with multiple values, linking to a single row in your fact table and use this dimension in the charts, the sum of rows will duplicate up the value (count all the duplicate rows), where as the expression total will not (it will still show the duplicate rows in the pivot chart, but won't affect the total)
hope that helps
Joe
- Mark as New
- Bookmark
- Subscribe
- Mute
- Subscribe to RSS Feed
- Permalink
- Report Inappropriate Content
Hello Diane
Can you tell me the expression used for the colmun 'CASH TARGET'?
is there null value?
- Mark as New
- Bookmark
- Subscribe
- Mute
- Subscribe to RSS Feed
- Permalink
- Report Inappropriate Content
Hi
Referring to Joe Simmons' post on sum of rows:
It may not be the data model that causes a problem. Expressions with ratios will also return different results in a pivot to a straight table with sum of rows enabled. The sum of set of ratios (sum of rows) is arithmetically not the same as the ratio of the sums (expression total).
HTH
Jonathan
- Mark as New
- Bookmark
- Subscribe
- Mute
- Subscribe to RSS Feed
- Permalink
- Report Inappropriate Content
thanks Jonathan, I just went with the one example that came to mind but yes true there are other potentials such as this good point
- Mark as New
- Bookmark
- Subscribe
- Mute
- Subscribe to RSS Feed
- Permalink
- Report Inappropriate Content
Hi All,
There won't be any nulls, but there are 0's. I've made sure on purpose!
Cash Target expression:
if([T8 Check]='Yes', Sum([Line Debt]),(Sum([Line Debt])/100)*$(CashTarget))
The '$(CashTarget)' is an variable based on an input box.
Thanks
Di
- Mark as New
- Bookmark
- Subscribe
- Mute
- Subscribe to RSS Feed
- Permalink
- Report Inappropriate Content
Strange it should not be like this.
Can you check the Dimension Limit in Straight Table. Is there any limitation put by you for expression of Cash Target? If yes, then remove the same and check the answer.
- Mark as New
- Bookmark
- Subscribe
- Mute
- Subscribe to RSS Feed
- Permalink
- Report Inappropriate Content
Hi,
Nothing is ticked in regards to dimension limits in regards to straight table.
Have added jpeg showing the expressions of the two tables.
Its really confusing me as to why its happening. All the data and the formulas are correct in both tables, its just the totals!
Arghhhhhhh!
Di
- Mark as New
- Bookmark
- Subscribe
- Mute
- Subscribe to RSS Feed
- Permalink
- Report Inappropriate Content
Hi Diane,
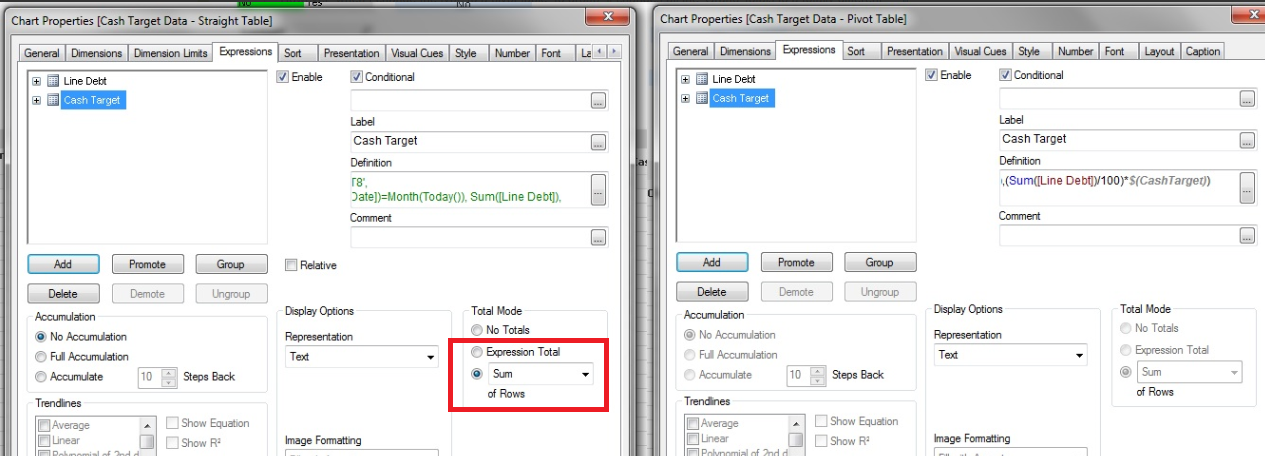
Please see my earlier post about sum of rows, looks like this is your issue. If you adjust the straight table to be expression totals the charts should match for you.
As for the difference between the two, this will likely be down to a data issue as I have said
hope that helps
Joe
- Mark as New
- Bookmark
- Subscribe
- Mute
- Subscribe to RSS Feed
- Permalink
- Report Inappropriate Content
Hi,
Post a sample data with your logic.
Regards,
Kavita
- « Previous Replies
-
- 1
- 2
- Next Replies »