Unlock a world of possibilities! Login now and discover the exclusive benefits awaiting you.
- Qlik Community
- :
- All Forums
- :
- QlikView App Dev
- :
- End/Start of Period volumes
- Subscribe to RSS Feed
- Mark Topic as New
- Mark Topic as Read
- Float this Topic for Current User
- Bookmark
- Subscribe
- Mute
- Printer Friendly Page
- Mark as New
- Bookmark
- Subscribe
- Mute
- Subscribe to RSS Feed
- Permalink
- Report Inappropriate Content
End/Start of Period volumes
Hi,
I have a raw file showing policy numbers, their start dates and end dates. Someting like this:
| Policy Number | StartDate (dd/mm/yyyy) | EndDate (dd/mm/yyyy) |
| P1 | 01/01/2010 | 30/06/2010 |
| P2 | 01/01/2010 | 31/12/2010 |
| P3 | 01/01/2010 | 31/12/2010 |
| P4 | 01/02/2010 | 31/12/2010 |
| P5 | 01/06/2010 | 30/06/2010 |
| P6 | 01/06/2010 | 30/06/2010 |
| P7 | 01/06/2010 | 31/07/2010 |
| P8 | 01/06/2010 | 31/12/2010 |
| P9 | 01/06/2010 | 31/12/2010 |
| P10 | 01/06/2010 | 31/12/2010 |
What i want to get is a table that will calculate the volumes of in-force policies at month start for the 12 months of 2010. Something like this:
| Month | Jan-10 | Feb-10 | Mar-10 | Apr-10 | May-10 | Jun-10 | Jul-10 | Aug-10 | Sep-10 | Oct-10 | Nov-10 | Dec-10 |
| In-Force policies | 3 | 4 | 4 | 4 | 4 | 10 | 7 | 7 | 7 | 7 | 7 | 7 |
How to script this - any suggestions are most welcome?
I only managed to get this view but i find it hard to present it the way shown above:
| Month | Started | Ended |
| Jan 2010 | 3 | 0 |
| Feb 2010 | 1 | 0 |
| Jun 2010 | 6 | 3 |
| Jul 2010 | 0 | 1 |
| Dec 2010 | 0 | 6 |
Best Regards & Thanks,
Artur
- « Previous Replies
-
- 1
- 2
- Next Replies »
- Mark as New
- Bookmark
- Subscribe
- Mute
- Subscribe to RSS Feed
- Permalink
- Report Inappropriate Content
Hello Nicole,
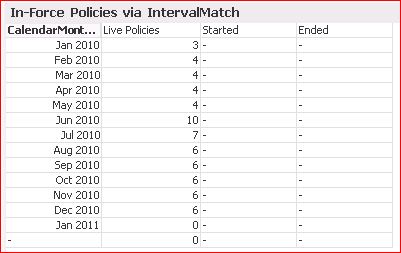
attached is the app with intervalmatch done on calendar date that helped to avoid the loops.
Now in this table Live Policies volumes look good but I also need to show volumes that Started and Ended and i cannot figure out how to do this in this data model. Hope you can help again!
That's a pity that it is not possible to export the results of intervalmatch into a qvd - it would make the whole thing much easier.
Regards & Thanks,
Artur
- Mark as New
- Bookmark
- Subscribe
- Mute
- Subscribe to RSS Feed
- Permalink
- Report Inappropriate Content
Have a look at the attached.
- Mark as New
- Bookmark
- Subscribe
- Mute
- Subscribe to RSS Feed
- Permalink
- Report Inappropriate Content
Many thanks Nicole. Your solution does the trick perfectly.
Regards,
Artur
- « Previous Replies
-
- 1
- 2
- Next Replies »