Unlock a world of possibilities! Login now and discover the exclusive benefits awaiting you.
- Qlik Community
- :
- All Forums
- :
- QlikView App Dev
- :
- End User Chart
- Subscribe to RSS Feed
- Mark Topic as New
- Mark Topic as Read
- Float this Topic for Current User
- Bookmark
- Subscribe
- Mute
- Printer Friendly Page
- Mark as New
- Bookmark
- Subscribe
- Mute
- Subscribe to RSS Feed
- Permalink
- Report Inappropriate Content
End User Chart
Can the end user create their own dashboards. Assuming we have the list of Dimension and Measures, Can the end user create dashboards on their own.
Currently we have Adhoc dashboard with list of Dimensions and Measures. User can select the Dim and Measure, then the chart will populate. But the chart will be fixed say Line or Bar.
There is an option of giving the list of charts similar as providing the Dimension list.
Egs- Line, Bar, Pie will be provided as selection list similar to Dimension and Measure.
User can select Month from Dimension, Sales from Measure and Bar from Chart type. Once done we can populate Bar chart. For this we will have chart already populated and once clicked it will show at the front.
But I am expecting if Qlikview has the functionality such as User can drag drop and create their own charts?
Accepted Solutions
- Mark as New
- Bookmark
- Subscribe
- Mute
- Subscribe to RSS Feed
- Permalink
- Report Inappropriate Content
HI,
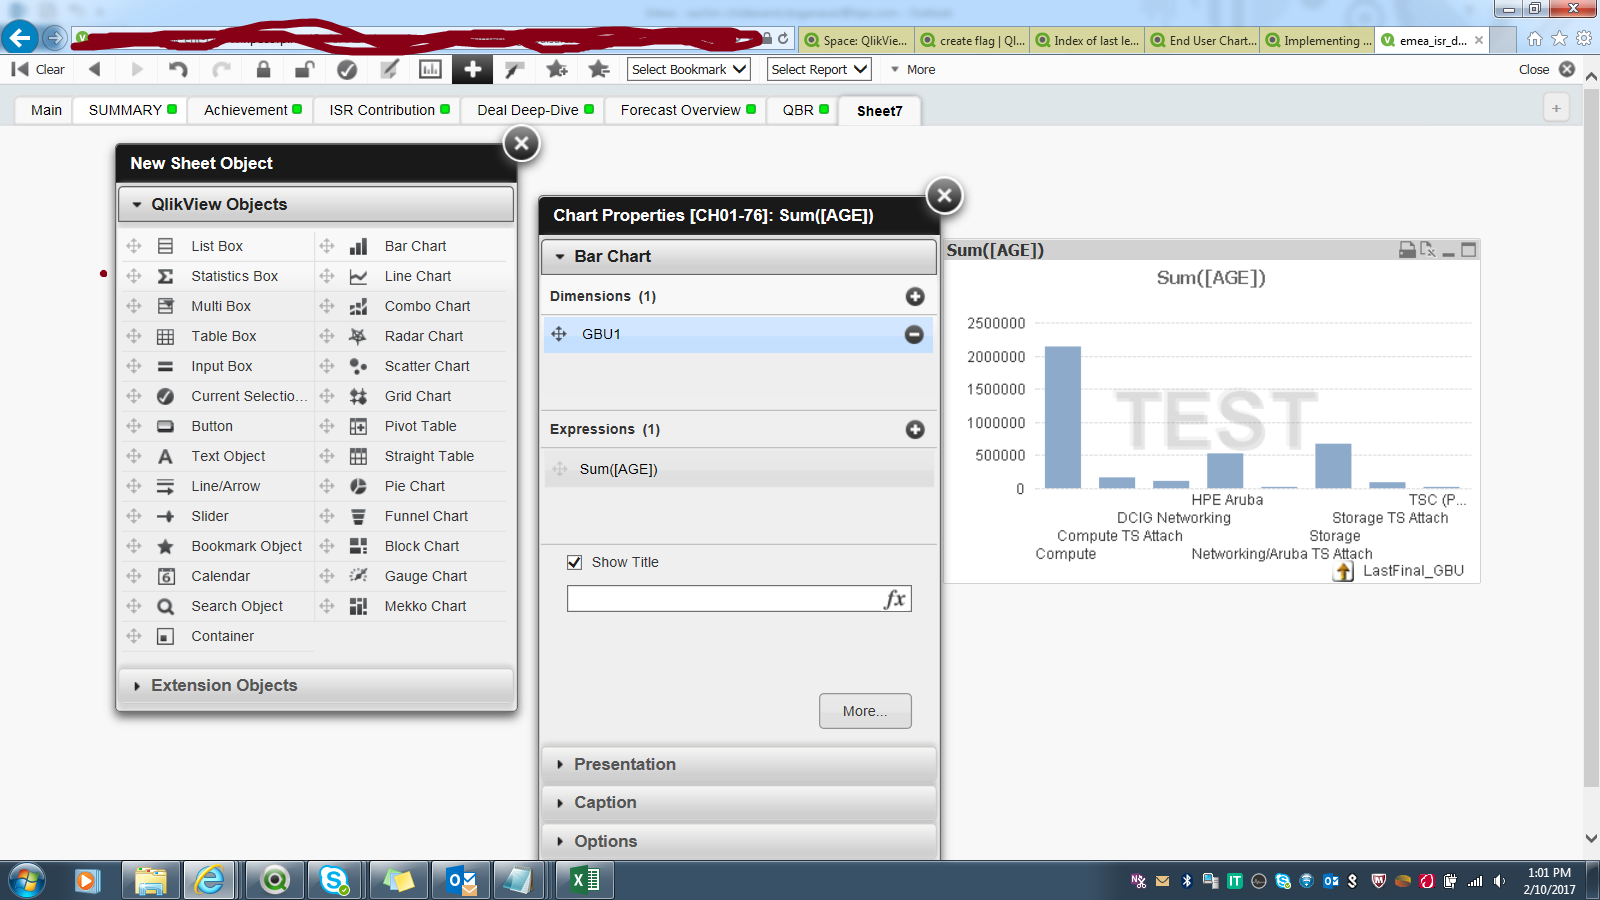
Yes user can add objects and play around with dimension and measures.
The screen shot how it looks fr them is attaced.Fr that they have to right click then new sheet object then its drag n drop of objects fr them.
Then can evevn add new sheets n try
- Mark as New
- Bookmark
- Subscribe
- Mute
- Subscribe to RSS Feed
- Permalink
- Report Inappropriate Content
Yes you can, Go to chart properties > General > right hand side bottom ..you will check the Types of Chart option select the chart you want to give as an option
OR
The end user can add a chart in the access point also, right click and select new sheet object and select the chart he want
- Mark as New
- Bookmark
- Subscribe
- Mute
- Subscribe to RSS Feed
- Permalink
- Report Inappropriate Content
HI,
Yes user can add objects and play around with dimension and measures.
The screen shot how it looks fr them is attaced.Fr that they have to right click then new sheet object then its drag n drop of objects fr them.
Then can evevn add new sheets n try
- Mark as New
- Bookmark
- Subscribe
- Mute
- Subscribe to RSS Feed
- Permalink
- Report Inappropriate Content
Yes, you can ; there is a flag you should enable/disable in the QMC (Qlik Management Console)