Unlock a world of possibilities! Login now and discover the exclusive benefits awaiting you.
- Qlik Community
- :
- All Forums
- :
- QlikView App Dev
- :
- Re: Forecasting or Predicting Sales for next one M...
- Subscribe to RSS Feed
- Mark Topic as New
- Mark Topic as Read
- Float this Topic for Current User
- Bookmark
- Subscribe
- Mute
- Printer Friendly Page
- Mark as New
- Bookmark
- Subscribe
- Mute
- Subscribe to RSS Feed
- Permalink
- Report Inappropriate Content
Forecasting or Predicting Sales for next one Month or Year
Hi All,
I have a line chart with data.
I want to Predict the next one month Sales based on the Current Sales.
Can we do it in Qlikview ??
I want the Predictive data to be displayed in Dotted Lines
Thanks & Regards,
Keerthi
- Mark as New
- Bookmark
- Subscribe
- Mute
- Subscribe to RSS Feed
- Permalink
- Report Inappropriate Content
Hi Keerthi
Try Chart Properties => Axes => Forecast
Lukasz
- Mark as New
- Bookmark
- Subscribe
- Mute
- Subscribe to RSS Feed
- Permalink
- Report Inappropriate Content
Please tell me in detail.
- Mark as New
- Bookmark
- Subscribe
- Mute
- Subscribe to RSS Feed
- Permalink
- Report Inappropriate Content
from QlikView reference:
Backcast This function operates on trend lines. Enter into the text edit box how far back
you would like to estimate the trend line. The backcast portion of trend lines is displayed as dotted.
Forecast Enter into the text edit box how far you wish to predict the trend line. The forecast portion of trend lines is displayed as dotted.
- Mark as New
- Bookmark
- Subscribe
- Mute
- Subscribe to RSS Feed
- Permalink
- Report Inappropriate Content
Can you send an example ??
- Mark as New
- Bookmark
- Subscribe
- Mute
- Subscribe to RSS Feed
- Permalink
- Report Inappropriate Content
It's all up to trendline you want to use, but with linear trendline it would be something like in attached document
- Mark as New
- Bookmark
- Subscribe
- Mute
- Subscribe to RSS Feed
- Permalink
- Report Inappropriate Content
Hello,
You want like following:
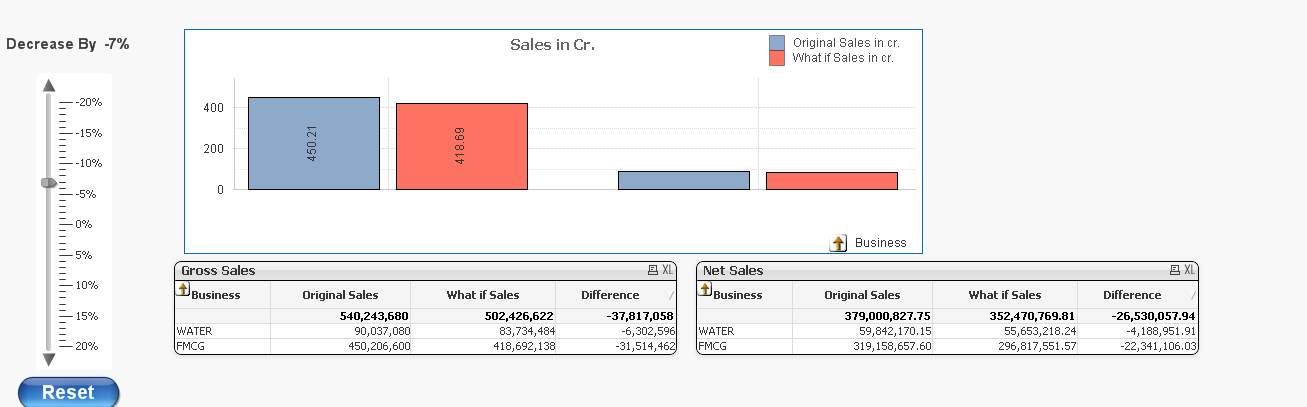
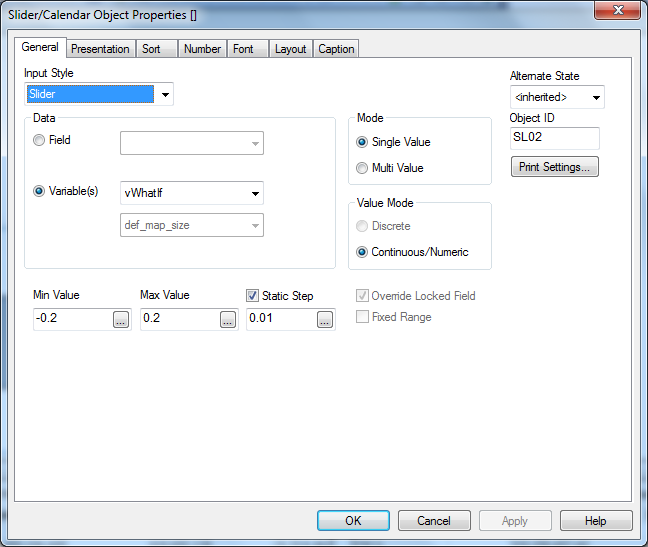
Create a variable vWhatIf and use it in slider
For slider use following setting
in expression use
1st expression:sum(sales)
2nd expression for forecast:(sum(sales* (1 + vWhatIf))
Regards
- Mark as New
- Bookmark
- Subscribe
- Mute
- Subscribe to RSS Feed
- Permalink
- Report Inappropriate Content
Hi,
As you told, you like to display predicted data on the chart. So, i thing trendline and forecast will not be good solution in your case. I think you should rather calculate your prediction in load script or in expressions, depending if your prediction algorithm depends less or more on user selections.
regards
Darek