Unlock a world of possibilities! Login now and discover the exclusive benefits awaiting you.
- Qlik Community
- :
- All Forums
- :
- QlikView App Dev
- :
- Re: Format the values on DataPoints to ###,###
- Subscribe to RSS Feed
- Mark Topic as New
- Mark Topic as Read
- Float this Topic for Current User
- Bookmark
- Subscribe
- Mute
- Printer Friendly Page
- Mark as New
- Bookmark
- Subscribe
- Mute
- Subscribe to RSS Feed
- Permalink
- Report Inappropriate Content
Format the values on DataPoints to ###,###
Hello Qlixperts
Happy new year to all!!!
I want to format the value on the Data points to ###,### 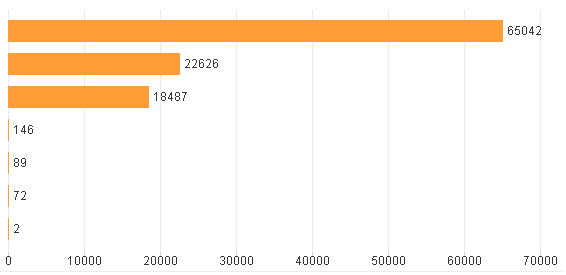
I want to display 65042 as 650,42..
Please advice something to acheive the result
Thanks
Varun
Accepted Solutions
- Mark as New
- Bookmark
- Subscribe
- Mute
- Subscribe to RSS Feed
- Permalink
- Report Inappropriate Content
Hi Varun,
you have several options, first you could use the Num() function around your expression to adjust the format to your desired output.
Num ([Expression], '###,###')
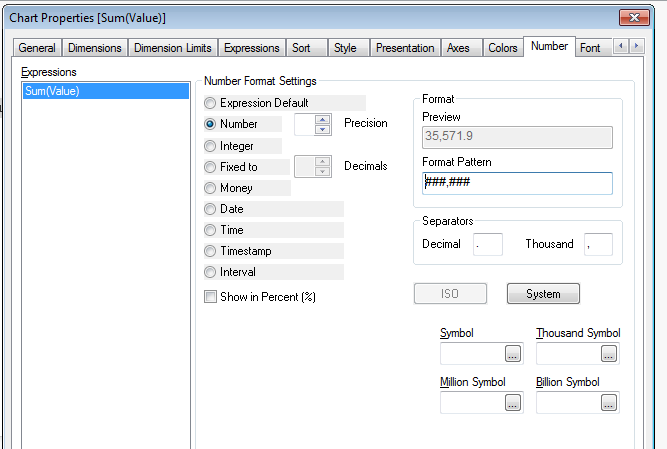
Or you can use the number tab within the chart properties.
hope that helps
Joe
- Mark as New
- Bookmark
- Subscribe
- Mute
- Subscribe to RSS Feed
- Permalink
- Report Inappropriate Content
Hi Varun,
you have several options, first you could use the Num() function around your expression to adjust the format to your desired output.
Num ([Expression], '###,###')
Or you can use the number tab within the chart properties.
hope that helps
Joe
- Mark as New
- Bookmark
- Subscribe
- Mute
- Subscribe to RSS Feed
- Permalink
- Report Inappropriate Content
In your expression, wrap it in the num() function and specify your desired output, so:
Num([Your Expression], '###,###')
- Mark as New
- Bookmark
- Subscribe
- Mute
- Subscribe to RSS Feed
- Permalink
- Report Inappropriate Content
Thanks Aaron Morgan and JoeSimmons
I have a container and 4 bar charts init, The above sollution is works fine for three charts and for one chart I am not able to Change the format
Any Idea to sort this out?
Appreciate your help
Thanks
Varun
- Mark as New
- Bookmark
- Subscribe
- Mute
- Subscribe to RSS Feed
- Permalink
- Report Inappropriate Content
What type of chart is it, and what's the expression?