Unlock a world of possibilities! Login now and discover the exclusive benefits awaiting you.
- Qlik Community
- :
- All Forums
- :
- QlikView App Dev
- :
- Re: Formatting graphs
- Subscribe to RSS Feed
- Mark Topic as New
- Mark Topic as Read
- Float this Topic for Current User
- Bookmark
- Subscribe
- Mute
- Printer Friendly Page
- Mark as New
- Bookmark
- Subscribe
- Mute
- Subscribe to RSS Feed
- Permalink
- Report Inappropriate Content
Formatting graphs
Hi again,
I have two questions regarding how to structure and format numbers in a graph. I am using a Line Chart for this.
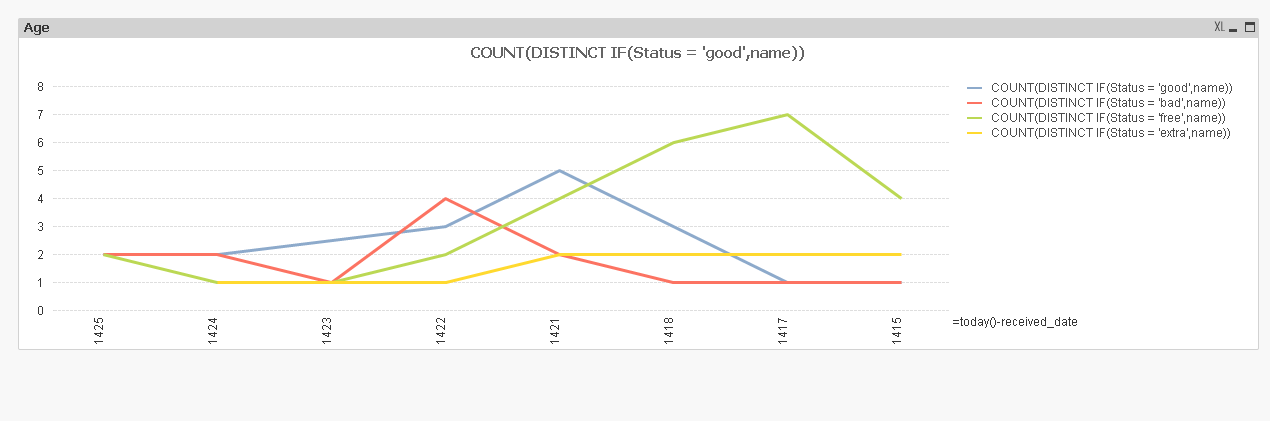
1. The graph i have is filled with 0 values. That makes it look very "skippy" with the graph jumping up an down. Is there a way to smooth this graph out? I know there is a function under the Expression Tab to use the trend lines, but I dont think this gives a good enough representation.
2. I would like to input a line marking the 1200 point. This would be a vertical, static line at 1200 running through the graph. Any ideas?
Cheers,
- « Previous Replies
- Next Replies »
- Mark as New
- Bookmark
- Subscribe
- Mute
- Subscribe to RSS Feed
- Permalink
- Report Inappropriate Content
Hi Nils,
regarding your second question:
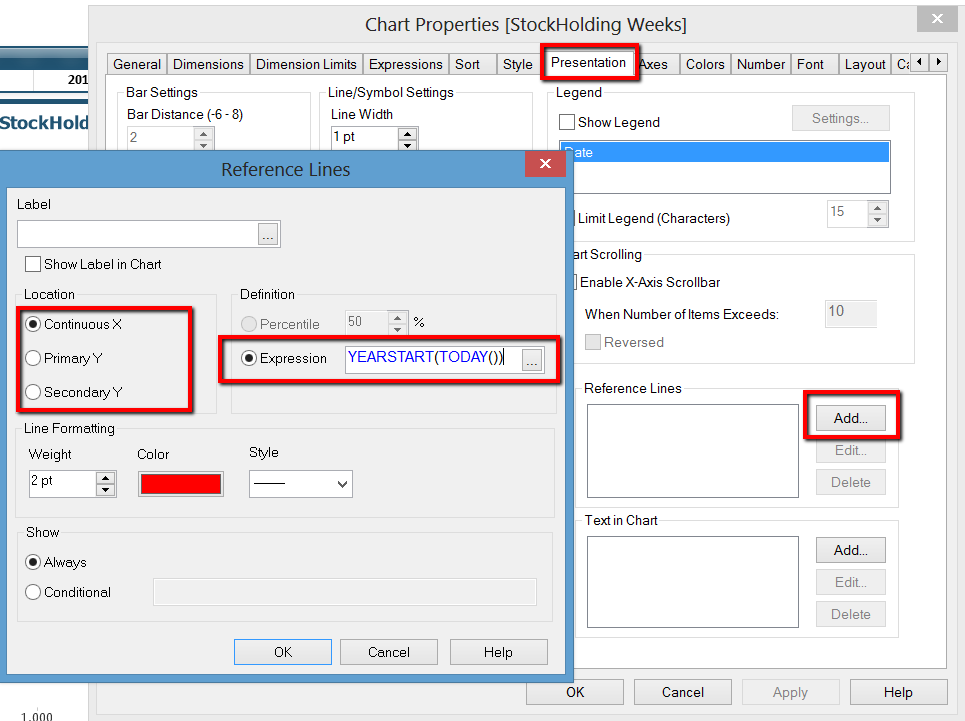
In chart properties
1. Axes Tab: You can mark the checkbox "Continuous" for the Dimension Axis.
2. Presentation Tab: Reference Lines "Add..Expression: 1200
I think u have to add a static min/max on the Axes tab.
Could you explain the first problem further... ?
Regards peter
- Mark as New
- Bookmark
- Subscribe
- Mute
- Subscribe to RSS Feed
- Permalink
- Report Inappropriate Content
thank you peter,
1. that solved it 
2. i cant get the reference line to set up for 1200 vertically. i can only get it to lay down on the x-axis. i just opened the expression and set it to:
=today()-received_date=1200
but this is not working.
- Mark as New
- Bookmark
- Subscribe
- Mute
- Subscribe to RSS Feed
- Permalink
- Report Inappropriate Content
Hi Nils,
Your app doesn't have any zero,, its just one...what i feel is your expression might need some chages...
can you explain your requirement???
-Sundar
- Mark as New
- Bookmark
- Subscribe
- Mute
- Subscribe to RSS Feed
- Permalink
- Report Inappropriate Content
i need there to be a vertical line going through the graph at the 1200 point. just a red line marking in the graph where 1200 is.
- Mark as New
- Bookmark
- Subscribe
- Mute
- Subscribe to RSS Feed
- Permalink
- Report Inappropriate Content
is your requirement something like this?
see attachment..
For this i have added a background image in colors tab with a red line...
create an image with a red line where ever you want it to be.
Hope this helps...
-Sundar
- Mark as New
- Bookmark
- Subscribe
- Mute
- Subscribe to RSS Feed
- Permalink
- Report Inappropriate Content
Hi Nils,
this video on youtube may help
Qlikview Vertical Reference Lines by RFB 147
Also see below, On the presentation tab, add reference line with your expression, you can say =1200 for your expression
- Mark as New
- Bookmark
- Subscribe
- Mute
- Subscribe to RSS Feed
- Permalink
- Report Inappropriate Content
hi, i cant see any youtube link?
- Mark as New
- Bookmark
- Subscribe
- Mute
- Subscribe to RSS Feed
- Permalink
- Report Inappropriate Content
I did not send the link as sometimes it takes days to be authorised by the Community manager
if you go to youtube and type in
Qlikview Vertical Reference Lines by RFB 147
- Mark as New
- Bookmark
- Subscribe
- Mute
- Subscribe to RSS Feed
- Permalink
- Report Inappropriate Content
sorry, but that will not do. i need it to be dynamic in the graph since i may need to scroll the graph/change the dimensions of it. then i need the line to follow along. but yes, you got the general idea
- « Previous Replies
- Next Replies »