Unlock a world of possibilities! Login now and discover the exclusive benefits awaiting you.
- Qlik Community
- :
- All Forums
- :
- QlikView App Dev
- :
- Re: Fractile Function with Fiscal Week field wise ...
- Subscribe to RSS Feed
- Mark Topic as New
- Mark Topic as Read
- Float this Topic for Current User
- Bookmark
- Subscribe
- Mute
- Printer Friendly Page
- Mark as New
- Bookmark
- Subscribe
- Mute
- Subscribe to RSS Feed
- Permalink
- Report Inappropriate Content
Fractile Function with Fiscal Week field wise have to determine
Hi QV Guys,
I am facing problem to determine Fractile function in Pivot table or any chart in the dashboard level.
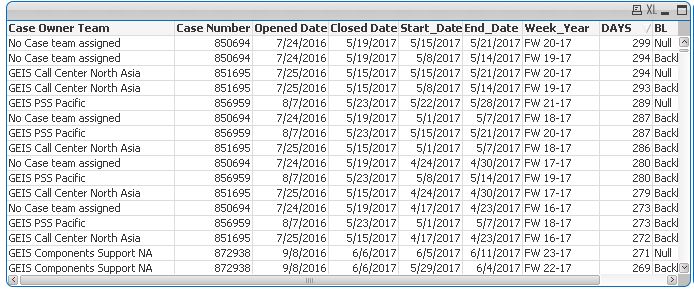
I am having week fiscal field and Days count value. So using Fiscal Week field i have to create the Fractile value with the Days field value. For reference i have attached a pic of a table with fields.
What I need to do next is chart the 25th and 75th percentiles. In Excel we use Percentile and QV function is Fractile
Functionality of Fractile function: Fractile() mystery revealed
Thanks
Chandu
- Mark as New
- Bookmark
- Subscribe
- Mute
- Subscribe to RSS Feed
- Permalink
- Report Inappropriate Content
So what is the issue you are running into? I guess you know that you have to use Fractile function, but I am not sure I understand what is missing?
- Mark as New
- Bookmark
- Subscribe
- Mute
- Subscribe to RSS Feed
- Permalink
- Report Inappropriate Content
If i use Fractile function then it will check entire column of DAYS field value.
But I didn't want entire column Fractile. I required it has to calculate with groupby of Week_Year Field.
I facing hurrdle how to implement Fractile function expression with groupby of Week_YearField?
Cheers,
Chandu
- Mark as New
- Bookmark
- Subscribe
- Mute
- Subscribe to RSS Feed
- Permalink
- Report Inappropriate Content
Would you be able to share a sample where you can show the problem and provide the expected output (in numerical terms)?