Unlock a world of possibilities! Login now and discover the exclusive benefits awaiting you.
- Qlik Community
- :
- All Forums
- :
- QlikView App Dev
- :
- Full Accumulation of multiple Dimmensions
- Subscribe to RSS Feed
- Mark Topic as New
- Mark Topic as Read
- Float this Topic for Current User
- Bookmark
- Subscribe
- Mute
- Printer Friendly Page
- Mark as New
- Bookmark
- Subscribe
- Mute
- Subscribe to RSS Feed
- Permalink
- Report Inappropriate Content
Full Accumulation of multiple Dimmensions
Hi everybody, I just got my feet wet with QlikView, working for @adumd in Ecolab.
Please in work told me to fix an accumulated expression in a chart which I still can't make heads or tails from it.
We currently have StartWeekCount table feeding up the chart which is loaded through the following statement:
StartWeekCount:
LOAD
RowNo() as WSRow,
AutoNumber(Upper(Ltrim(Rtrim(AssignmentGroup)))&Date(WeekStart, 'MM/DD/YYYY')) as WSKey,
Upper(Ltrim(Rtrim(AssignmentGroup)))&Date(WeekStart, 'MM/DD/YYYY') as WSCadena,
AssignmentGroup,
Date(WeekStart,'MM/DD/YYYY') as WSText,
OpenedIncidents,
ClosedIncidents,
TotalOpenedIncidents;
SQL SELECT distinct
WeekStart,
AssignmentGroup,
OpenedIncidents,
ClosedIncidents,
SUM(OpenedIncidents - ClosedIncidents) OVER (PARTITION BY AssignmentGroup ORDER BY WeekStart ROWS BETWEEN UNBOUNDED PRECEDING AND CURRENT ROW) AS TotalOpenedIncidents
FROM ServiceNow_HDM.dbo.WeekGroupIncidents;
We need the chart to tell us how many tickets were opened vs how many tickets were closed, accumulatively in a sort of backlog:
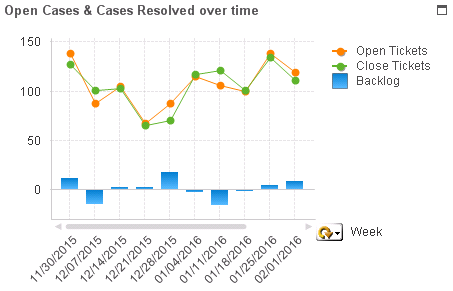
The first two expressions are easy, they are set simply to the sum of OpenedIncidents and ClosedIncidents respectively. The third expression, the Backlog, should be the difference between past OpenedIncidents and ClosedIncidents summed up through the entire table until the current row.
The third expression that they told me to fix is a bit troubling because the requirement tell us to accumulate rows even though they are not included in the current selection.
We cannot use the Full Accumulation checkbox because it only brings visible rows. Also we have tried using aggr and rangesum functions combined with set analysis expressions without success.
Please how we can achieve this? could anybody provide the formula for Backlog...
Thanks in advance!
- Mark as New
- Bookmark
- Subscribe
- Mute
- Subscribe to RSS Feed
- Permalink
- Report Inappropriate Content
There might be different solutions possible, maybe including a solution with advanced aggregation and set analysis.
But maybe have a look at the AsOf-Table concept;
Which should provide means of full accumulation back in time as required.
- Mark as New
- Bookmark
- Subscribe
- Mute
- Subscribe to RSS Feed
- Permalink
- Report Inappropriate Content
I use AsOf tables in quite a few places. I prefer data model solutions over expression solutions where possible. But my users seem to have trouble understanding the difference between As Of Month and Month. Just something to be aware of. Try to make it as clear as possible what's going on.
- Mark as New
- Bookmark
- Subscribe
- Mute
- Subscribe to RSS Feed
- Permalink
- Report Inappropriate Content
Thanks @swuehl I'll give it a try, and thanks @JohnW for the caveat!
- Mark as New
- Bookmark
- Subscribe
- Mute
- Subscribe to RSS Feed
- Permalink
- Report Inappropriate Content
Hi @swuehl thanks for your quick response, please is there any way to take advantage of the OVER (PARTITION BY AssignmentGroup ORDER BY WeekStart ROWS BETWEEN UNBOUNDED PRECEDING AND CURRENT ROW) to make the aggregation?
Can we use the FirstSortedValue expression? does it accrue a convenient solution?
Thanks!
- Mark as New
- Bookmark
- Subscribe
- Mute
- Subscribe to RSS Feed
- Permalink
- Report Inappropriate Content
Oh, yes, you probably can use the generated TotalOpenedIncidents in your chart.
What if you add as third expression:
=Sum(TotalOpenedIncidents)
(sum over the AssignmentGroup partitions)
Note that the script generated values are static, so won't consider your current selection, e.g. limit of week range.
edit:
And by the way and totally off-topic:
Great to have you back in the forum, John!
- Mark as New
- Bookmark
- Subscribe
- Mute
- Subscribe to RSS Feed
- Permalink
- Report Inappropriate Content
Thanks, swuehl, it's great to be back!