Unlock a world of possibilities! Login now and discover the exclusive benefits awaiting you.
- Qlik Community
- :
- All Forums
- :
- QlikView App Dev
- :
- Re: Funny Line Graph Results
- Subscribe to RSS Feed
- Mark Topic as New
- Mark Topic as Read
- Float this Topic for Current User
- Bookmark
- Subscribe
- Mute
- Printer Friendly Page
- Mark as New
- Bookmark
- Subscribe
- Mute
- Subscribe to RSS Feed
- Permalink
- Report Inappropriate Content
Funny Line Graph Results
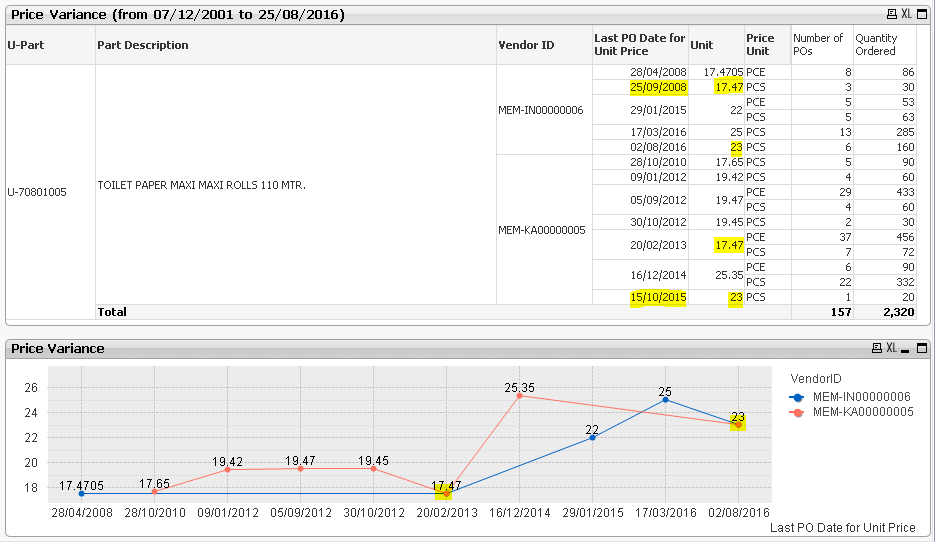
Hi i am trying to plot a line graph for two different vendors and how there unit prices for the same part varied over time. However, when the unit price is the same, the data points are plotted on the same date on the graph, thus showing incorrect interpretation of the pivot table data.
I inserted this screen shot with highlighted figures to better explain what the problem is. The highlighted dates on the pivot table are missing from the line graph.
Does someone know what this is happening?
Thanks 
Accepted Solutions
- Mark as New
- Bookmark
- Subscribe
- Mute
- Subscribe to RSS Feed
- Permalink
- Report Inappropriate Content
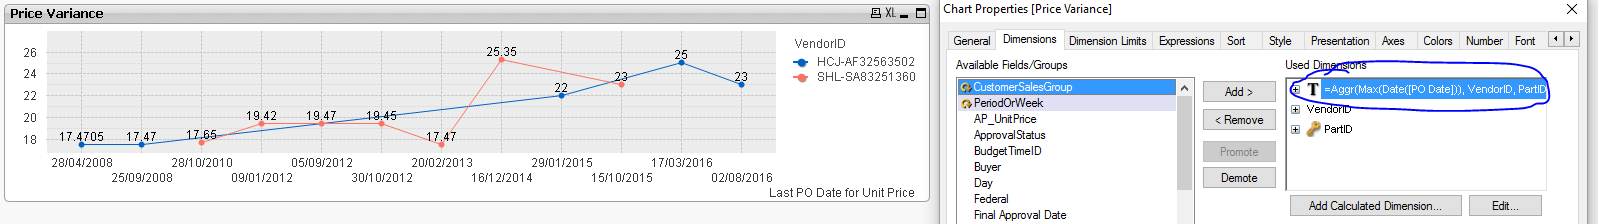
I think you need to fix your first dimension here.
You currently have
=Aggr(Max(Date([PO Date])), UnitPrice)
and need to change it to
=Aggr(Max(Date([PO Date])), VendorID, PartID, UnitPrice)
- Mark as New
- Bookmark
- Subscribe
- Mute
- Subscribe to RSS Feed
- Permalink
- Report Inappropriate Content
I suggest to share a demonstrative sample. Have a look here: Preparing examples for Upload - Reduction and Data Scrambling
- Mark as New
- Bookmark
- Subscribe
- Mute
- Subscribe to RSS Feed
- Permalink
- Report Inappropriate Content
I guess what is the expression that you are using in your chart?
- Mark as New
- Bookmark
- Subscribe
- Mute
- Subscribe to RSS Feed
- Permalink
- Report Inappropriate Content
Thanks Amit for that great post. I can now attach my QVW ! !
Would be great if someone can help!
- Mark as New
- Bookmark
- Subscribe
- Mute
- Subscribe to RSS Feed
- Permalink
- Report Inappropriate Content
I think you need to fix your first dimension here.
You currently have
=Aggr(Max(Date([PO Date])), UnitPrice)
and need to change it to
=Aggr(Max(Date([PO Date])), VendorID, PartID, UnitPrice)
- Mark as New
- Bookmark
- Subscribe
- Mute
- Subscribe to RSS Feed
- Permalink
- Report Inappropriate Content
This is because you calculated the max date aggregating against the Unit Price. What is expected output?
- Mark as New
- Bookmark
- Subscribe
- Mute
- Subscribe to RSS Feed
- Permalink
- Report Inappropriate Content
Thanks Sammy Sunny ( )!
)!
That was the problem.
- Mark as New
- Bookmark
- Subscribe
- Mute
- Subscribe to RSS Feed
- Permalink
- Report Inappropriate Content
Your are right Amit. The aggr function was incorrect and is now working perfectly fine.
- Mark as New
- Bookmark
- Subscribe
- Mute
- Subscribe to RSS Feed
- Permalink
- Report Inappropriate Content
No problem
Name is Sunny