Unlock a world of possibilities! Login now and discover the exclusive benefits awaiting you.
- Qlik Community
- :
- All Forums
- :
- QlikView App Dev
- :
- Gantt Chart using a pivot Table
- Subscribe to RSS Feed
- Mark Topic as New
- Mark Topic as Read
- Float this Topic for Current User
- Bookmark
- Subscribe
- Mute
- Printer Friendly Page
- Mark as New
- Bookmark
- Subscribe
- Mute
- Subscribe to RSS Feed
- Permalink
- Report Inappropriate Content
Gantt Chart using a pivot Table
I am working with data that has a start date and end date. I have researched building a Gantt chart using a pivot table and I am running into some road blocks. I am new to development, so I may be a little behind the curve. I have been able to create a stand alone Gantt chart, but need to add columns in front and the only way I have seen that this is possible is to use a pivot table.
I have seen a discussion in this forum, but the one I was looking at, was more for someone with a lot more knowledge than I have. I have my pivot built out.
I also have the Gantt calculations as follows:
1: MAX([AP End Date])-MIN([Load Date])
2: interval(Max ([AP End Date] )-Min ([AP Start Date]),'D') & ' days'
In my pivot table I have the following fields:
Primary Owner
LOB 1
LOB 2
AP Start Date
AP End Date
AP ID
AP Name
ID Source
Severity
AP Health
Any help would be greatly appreciated. Thank you for your time!
- « Previous Replies
-
- 1
- 2
- Next Replies »
Accepted Solutions
- Mark as New
- Bookmark
- Subscribe
- Mute
- Subscribe to RSS Feed
- Permalink
- Report Inappropriate Content
I already attached a QVW that is the example. It has a load script that does the data shaping.
The example is based on a table that looks very much like the pivot tables first 9 columns and I guess that is the same as your table is already right?
However the day# and the flag that indicates that the day participates in an active range of days for the task is generated with the LOAD .... RESIDENT .... WHILE part giving you a helper table that is associated with the first table via some unique identifier for each tracked task. This is what I call data shaping.
Here is the load script that you find in the attached QVW-file too:
![2017-01-04 23_19_00-Edit Script [C__Users_psd_Downloads_Gannt Chart with Pivot Table.qvw_].png](/legacyfs/online/148368_2017-01-04 23_19_00-Edit Script [C__Users_psd_Downloads_Gannt Chart with Pivot Table.qvw_].png)
When it comes to using data instead of day# you can just replace the last dimension for the Pivot Table with the Date field. The Date field has already been generated in the helper table. Some formatting is necessary to leave out the year part since it takes too much space.
![2017-01-04 23_19_22-QlikView x64 - [C__Users_psd_Downloads_Gannt Chart with Pivot Table.qvw_].png](/legacyfs/online/148369_2017-01-04 23_19_22-QlikView x64 - [C__Users_psd_Downloads_Gannt Chart with Pivot Table.qvw_].png)
- Mark as New
- Bookmark
- Subscribe
- Mute
- Subscribe to RSS Feed
- Permalink
- Report Inappropriate Content
Do you have some screenshots and or a sample QVW so it is quicker to help you out?
- Mark as New
- Bookmark
- Subscribe
- Mute
- Subscribe to RSS Feed
- Permalink
- Report Inappropriate Content
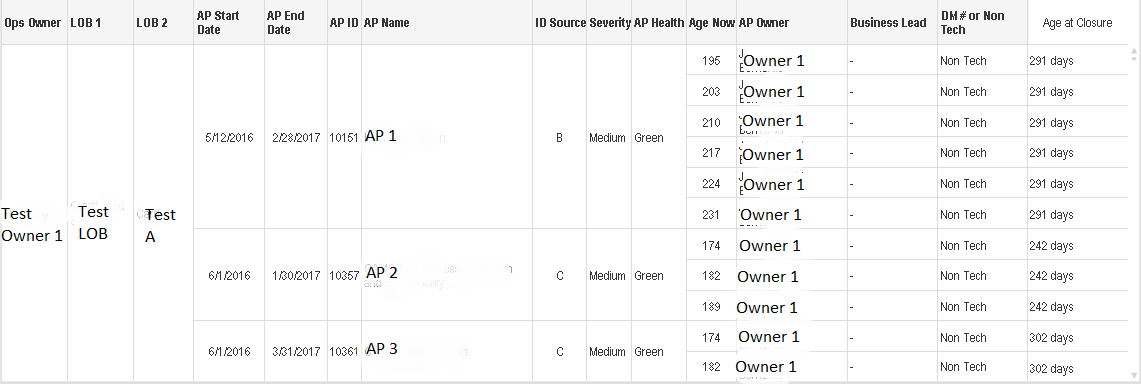
The top one is the pivot table, I had to change some things, which is why it is a bit odd looking, I had to hide items, due to this being for work and I cannot show the actual data.
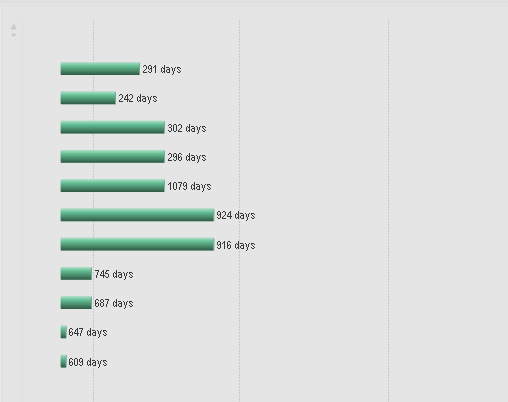
The bottom is the Gantt Chart that I would like to add to the pivot.
- Mark as New
- Bookmark
- Subscribe
- Mute
- Subscribe to RSS Feed
- Permalink
- Report Inappropriate Content
Is it something like this you had in mind?
![2017-01-04 18_19_44-QlikView x64 - [C__Users_psd_Downloads_QVD-header-info.qvw_].png](/legacyfs/online/148329_2017-01-04 18_19_44-QlikView x64 - [C__Users_psd_Downloads_QVD-header-info.qvw_].png)
- Mark as New
- Bookmark
- Subscribe
- Mute
- Subscribe to RSS Feed
- Permalink
- Report Inappropriate Content
A more realistic example:![2017-01-04 19_15_47-QlikView x64 - [C__Users_psd_Downloads_Gannt Chart with Pivot Table.qvw_].png](/legacyfs/online/148349_2017-01-04 19_15_47-QlikView x64 - [C__Users_psd_Downloads_Gannt Chart with Pivot Table.qvw_].png)
You have to do some data-shaping in the load script to generate a helper table (GANTT_CELLS) for the individual days to be able to use them as a dimension called Status that is pivoted out horisontally and using the value of 1 to indicate that this day is within the start and end date....
- Mark as New
- Bookmark
- Subscribe
- Mute
- Subscribe to RSS Feed
- Permalink
- Report Inappropriate Content
Yes, the second chart is exactly what I am looking to do. What do you mean by "Data Shaping" and creating a helper table? Can you show an example, please?
Thank you so much for your time!
- Mark as New
- Bookmark
- Subscribe
- Mute
- Subscribe to RSS Feed
- Permalink
- Report Inappropriate Content
but instead of Days across the top, I would need a date like what I have in the screen show, or Month.
- Mark as New
- Bookmark
- Subscribe
- Mute
- Subscribe to RSS Feed
- Permalink
- Report Inappropriate Content
I already attached a QVW that is the example. It has a load script that does the data shaping.
The example is based on a table that looks very much like the pivot tables first 9 columns and I guess that is the same as your table is already right?
However the day# and the flag that indicates that the day participates in an active range of days for the task is generated with the LOAD .... RESIDENT .... WHILE part giving you a helper table that is associated with the first table via some unique identifier for each tracked task. This is what I call data shaping.
Here is the load script that you find in the attached QVW-file too:
When it comes to using data instead of day# you can just replace the last dimension for the Pivot Table with the Date field. The Date field has already been generated in the helper table. Some formatting is necessary to leave out the year part since it takes too much space.
- Mark as New
- Bookmark
- Subscribe
- Mute
- Subscribe to RSS Feed
- Permalink
- Report Inappropriate Content
Thank you so much! I did not see an attachment, I apologize.
- Mark as New
- Bookmark
- Subscribe
- Mute
- Subscribe to RSS Feed
- Permalink
- Report Inappropriate Content
Here is how an attachment looks like (you find the real attachment further up):
- « Previous Replies
-
- 1
- 2
- Next Replies »