Unlock a world of possibilities! Login now and discover the exclusive benefits awaiting you.
- Qlik Community
- :
- All Forums
- :
- QlikView App Dev
- :
- Re: Gantt chart
- Subscribe to RSS Feed
- Mark Topic as New
- Mark Topic as Read
- Float this Topic for Current User
- Bookmark
- Subscribe
- Mute
- Printer Friendly Page
- Mark as New
- Bookmark
- Subscribe
- Mute
- Subscribe to RSS Feed
- Permalink
- Report Inappropriate Content
Gantt chart
Hello,
I'm currently working on a prototype app which includes a Gantt Chart. I had a few ideas which converge with the following article :
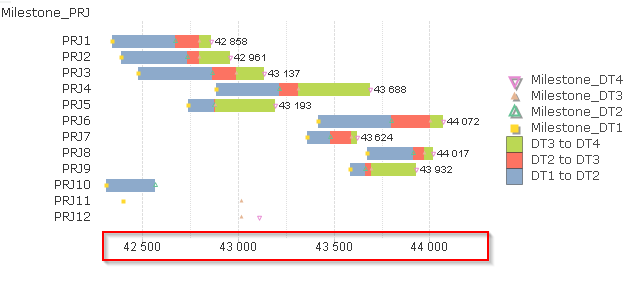
This lead me to the following, with four dates and three durations
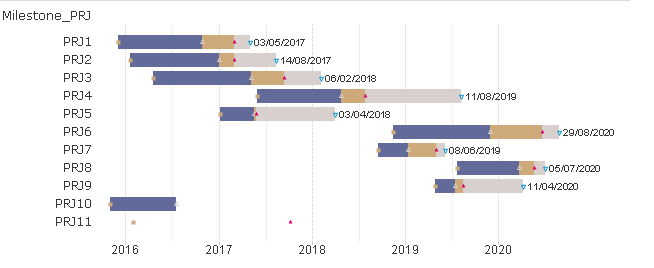
I was wondering about :
- the possibility to display another text on hover?
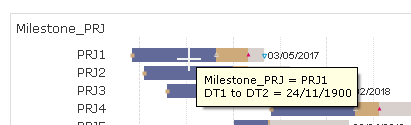
=> the difference between date 2 and date 1 is a number of days, but on display it is converted to date format.
- the possibility to display the DT1 value before the bar? Or to write M1 inside the blue bar, M2 inside the brown bar, M3 inside the gray bar.
Here is a demo app. Only colors are different.
Thank you!
- « Previous Replies
-
- 1
- 2
- Next Replies »
- Mark as New
- Bookmark
- Subscribe
- Mute
- Subscribe to RSS Feed
- Permalink
- Report Inappropriate Content
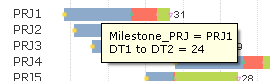
Because, You are considering and written as Date format in Number tab? Change it to number rather Date format
- Mark as New
- Bookmark
- Subscribe
- Mute
- Subscribe to RSS Feed
- Permalink
- Report Inappropriate Content
n the number tab you have made the expressions has date hence its showing it in the date format ...make it expression default and make you expression result according to your required format
Hope this helps you
- Mark as New
- Bookmark
- Subscribe
- Mute
- Subscribe to RSS Feed
- Permalink
- Report Inappropriate Content
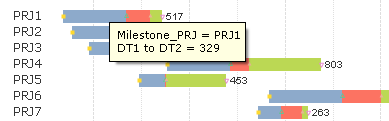
Thank you Anil. Indeed I had tried to set expressions (DT1 to DT2, DT2 to DT3 ) as "number" instead of "date"' but then the axis becomes a number too...
In your example, it looks like you "cheated" by making DT1 to DT2 a "date" with format DD, but then the displayed number is not the number of days between DT1 and DT2, it's the DD part of "DT1 to DT2" converted to date.
- Mark as New
- Bookmark
- Subscribe
- Mute
- Subscribe to RSS Feed
- Permalink
- Report Inappropriate Content
"DT2 to DT3" and "DT3 to DT4" are good though 
- Mark as New
- Bookmark
- Subscribe
- Mute
- Subscribe to RSS Feed
- Permalink
- Report Inappropriate Content
My bad, I've changes to only Number from number tab. If remaining two working then you must change the first one to number only.
- Mark as New
- Bookmark
- Subscribe
- Mute
- Subscribe to RSS Feed
- Permalink
- Report Inappropriate Content
Does your axis still show the dates? Mine doesn't if I set the 3 expressions to Number in number tab.
- Mark as New
- Bookmark
- Subscribe
- Mute
- Subscribe to RSS Feed
- Permalink
- Report Inappropriate Content
Thank you Avinash, however if I set the first three expressions as "expression default" or "number", then the axis becomes a number too, which is worse! (please refer to my answer to Anil) Unless you know a way to keep both a number in the bar and a date in the axis?
- Mark as New
- Bookmark
- Subscribe
- Mute
- Subscribe to RSS Feed
- Permalink
- Report Inappropriate Content
Will you explain, Where you are getting the Years(X-Axis) ???
- Mark as New
- Bookmark
- Subscribe
- Mute
- Subscribe to RSS Feed
- Permalink
- Report Inappropriate Content
The years that are shown in the axis in the first app I've shared are just due to the values of "DT1 to DT2" bar offset + the three expressions, and to the values of Milestone_DT1, Milestone_DT2, Milestone_DT3,Milestone_DT4.
They are date values, but because of the range/precision/zoom of the graph, it automatically shows the Year. With different Load inline values (narrower range), you would get DD/MM/YYYY in the axis (Try load inline with only PRJ0 that is commented in the script).
- « Previous Replies
-
- 1
- 2
- Next Replies »